eCQMs Outnumber Chart-Abstracted Measure for the First Time in 2017
By Kristen Beatson, RN September 30, 2016 Regulatory Updates: Hospital

For the first time ever, the required number of Electronic Clinical Quality Measures (eCQMs) will outnumber the required number of chart-abstracted measures for the CMS Inpatient Quality Reporting (IQR) program in 2017.
CMS is requiring hospitals to submit eight eCQMs and only six chart-abstracted measures.
In this blog, we will review the difference between how the eCQMs and chart-abstracted measures are calculated so that you can better understand the implications of this shift and how to implement necessary changes for reporting.
What is the measure intent?
First of all, we will need a measure to review. Let’s use Stroke 10 / NQF 441 as an example measure for comparison. Say John Doe comes into our hospital as a stroke patient. John must be assessed for rehab before he is discharged from the hospital. Clinicians note whether this was or was not completed. In the simplest terms, if John was assessed for rehab, he passes the measure. If not – and John does not have any applicable exclusions – he fails the measure. This is essentially the intent of this measure; does the patient pass or fail the measure based on the actions taken by the hospital staff?
The Differences
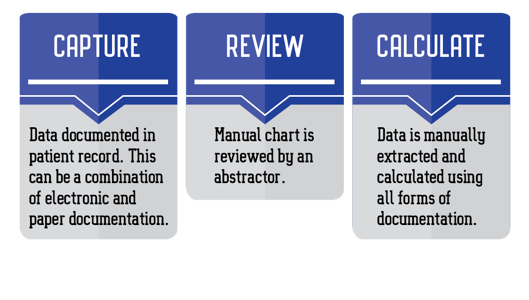
The main difference between eCQMs and chart-abstracted measures is that with chart-abstracted measures, the suggested data sources for abstraction can be paper, electronic, structured or unstructured allowable values. The eCQMs only use structured data that is electronically documented.
For example, a hospital abstractor can pull together all of the patient’s records (electronic and paper documentation) to assess whether they have passed or failed the measure. So if a clinician documented in a hand-written progress note that they assessed the patient for rehab, an abstractor could use that documentation to confirm that the patient did pass the measure.
With eCQMs, the clinician must document in a structured (mapped!) field in the Electronic Health Record (EHR), at the point-of-care, that the action was appropriately taken and therefore, the patient passed the measure.
Let’s use our stroke patient example again. eCQMs are calculated by pulling the data found within the EHR. Was our patient assessed for rehab before leaving the hospital? If the answer found within the EHR is yes and that documentation is mapped to the appropriate SNOMED code, then that patient passes the measure.
So if that clinician wrote a progress note, but did not record it electronically in the EHR, then that information doesn’t count; therefore, that patient fails the electronic measure.
Measure Data Capture & Calculation
As you would expect, the process for eCQM data capture and result calculation is a bit different and more complex than with chart-abstracted measures.
In order for hospitals to accurately capture and submit eCQMs, a hospital must have fully implemented the eCQM requirements. Implementation is a complex process involving measure education, workflow review, mapping and validating results using a configured a solution (like Medisolv’s ENCOR software) to evaluate and calculate the eCQMs.
Comparing the Two Processes
Chart-Abstracted Measure Process
eCQM Process
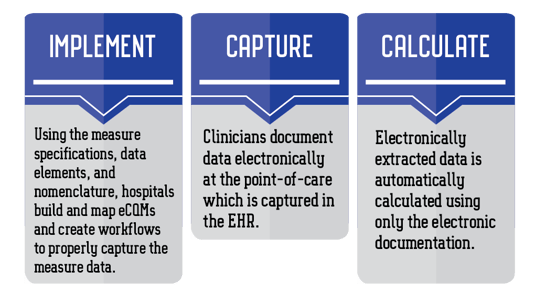
As you can see in the examples above, the process for capture and calculation is different.
Now if you’re feeling really good about what you’ve learned so far and don’t want to dive any deeper, stop here. Go have a drink to celebrate your incredible brain power. This stuff is tough!
If, however, you are feeling up for a challenge, continue reading. We are going to compare the chart-abstracted specifications and algorithm to the eCQM specifications and logic. Here we go!
Comparing Specifications
Clinical Rationale
Chart-abstracted
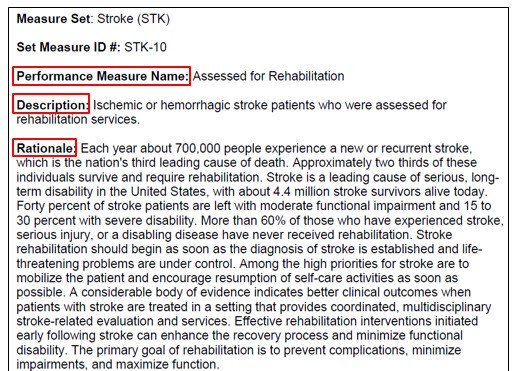
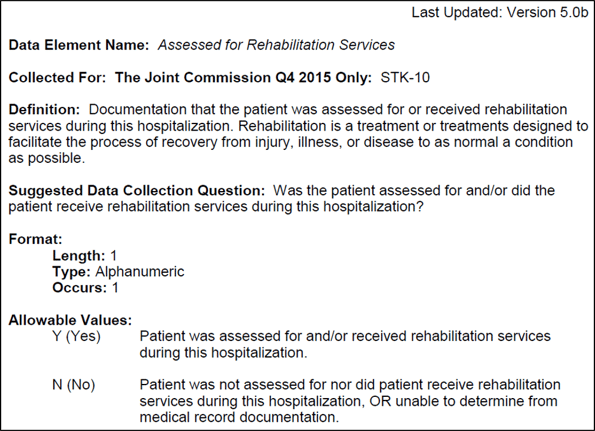
Here is a screenshot of the chart-abstracted clinical rational for the measure STK-10, which aligns with our example from above; was the patient assessed for rehab?
Note the name, description and rationale.
Now let’s compare that to the eCQM clinical rationale.
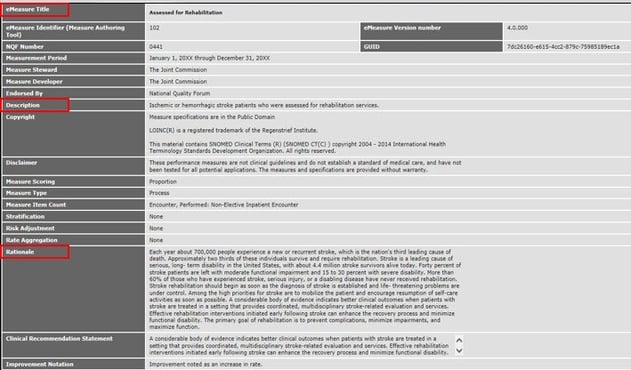
eCQM
From a high level, things look very similar. Note that the name, description and rationale are exactly the same as what you have on your chart-abstracted measure. Of course, there is a little more information contained here, but essentially it all looks pretty similar at this point.
Algorithm/Logic
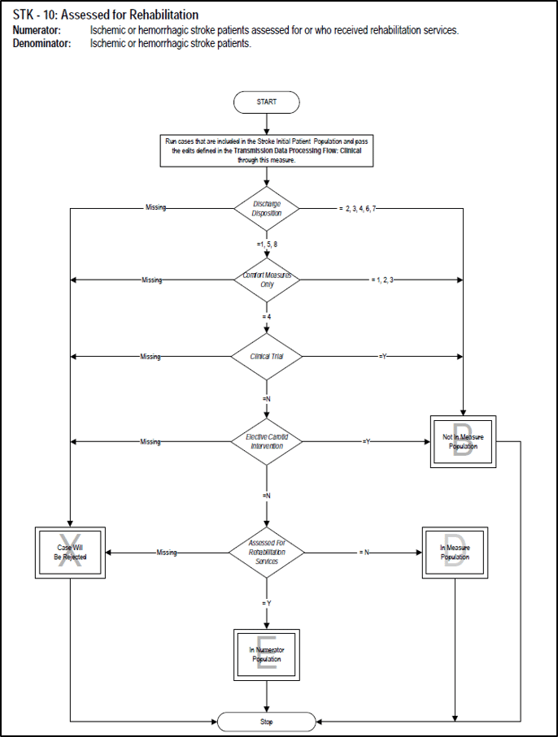
Chart-abstracted Algorithm
The chart-abstracted measure provides us with a nice visual to illustrate the algorithm. Note how the patient progresses through the algorithm to be counted as a numerator or denominator.
eCQM Logic
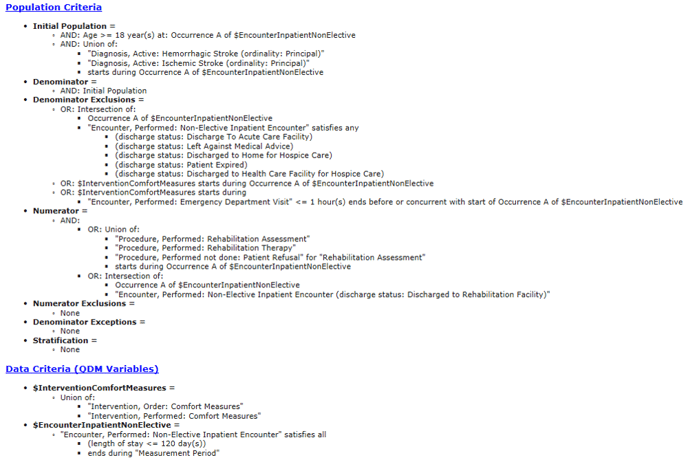
The equivalent of the chart-abstracted algorithm is the eCQM logic. Let’s take a look.
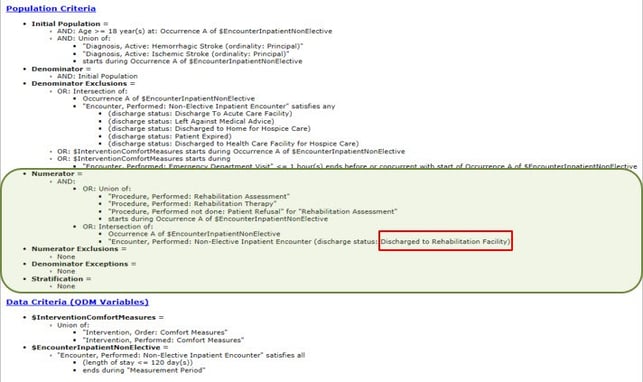
It’s not exactly intuitive. The patient qualifies for the numerator or denominator based on this Boolean logic, which includes many of these statements: and, or, union of, intersection of. It takes time and practice to become familiar and comfortable with the eCQM logic.
Initial Patient Population (IPP) & Denominator Calculation
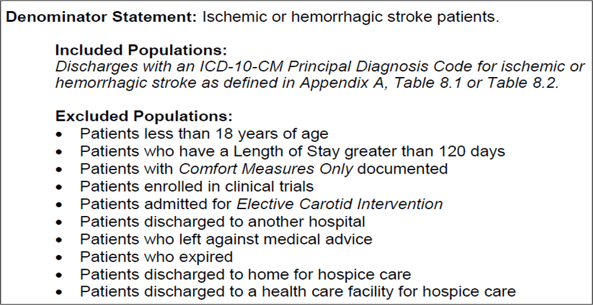
Chart-abstracted
The statement below is pretty human readable. You can easily work out what qualifies the patient to be a part of the IPP or Denominator by reading the statement below.
eCQM
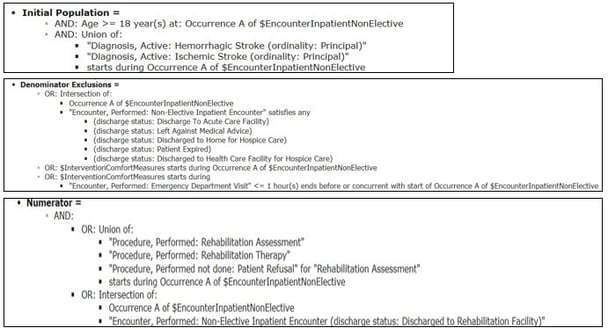
Here we have the IPP and Denominator calculation, but it’s a bit more complicated and not very human readable.
It will help you to think of these statements as a true or false statement. By applying a true or false to the statement, it will help you to understand how the IPP and Denominator are calculated.
Numerator
Chart-abstracted
Again, on the chart-abstracted side, the numerator language is straightforward. There is not a lot of data to interpret.
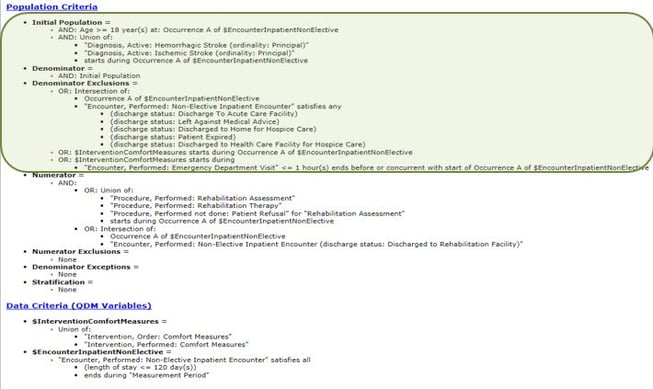
eCQM
In the example above, we’ve highlighted the statements that will qualify the patient for the numerator in the eCQM logic. Again, this example is not as clear as the chart-abstracted measures.
Data Elements
Chart-Abstracted
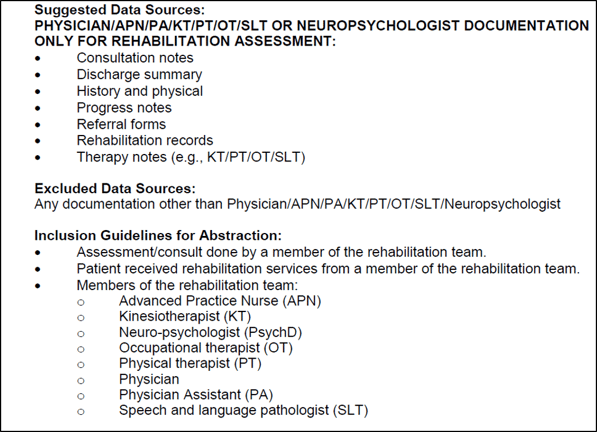
Your data elements give you information on the data requirements for the measure. They also provide information on suggested data sources. This is not available on the eCQM side.
Note that many of the items listed here, i.e. notes, referral forms, etc, may still be in paper or partially in paper at your facility. Those types of records are not applicable to the eCQM. Obviously the electronic data element cannot be pulled from the paper.
eCQM
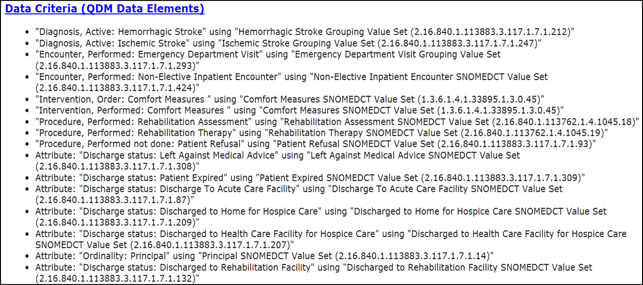
In the eCQM logic above, each line item represents a different data element. Most data elements require a qualifying code and are evaluated individually within the reporting system that you are using. If there isn’t a code present or if it’s the wrong code, it won’t get evaluated, which will cause the patient to fall out of the measure. At this point, it starts to look very different from the chart-abstracted measure.
These qualifying codes are found within a specific value-set. Value sets are associated with each individual data element. For instance, a different value set will be associated with discharge status, comfort measures, assessed for rehab and so on.
Every data element that requires a code is listed at the bottom of the measure specification along with the associated OID (value set identifier).
The value sets contain a list of acceptable codes and descriptions. You can look up the value sets and view the associated codes on the VSAC (Value Set Authority Center) web-site.
You will need to review these codes, decide which codes align with your documentation – or build new documentation – and then map the codes to your orders, documentation, etc. This needs to be completed for every applicable data element in order for patients to qualify for the appropriate measure population. Wrong code? No code? Either of these scenarios will result in an inaccurate eCQM result
Oh, and did we mention that the specs, value sets and codes are updated annually? So you get to enjoy going through this process every year!

Let's Wrap Up
Are you still with me? Mic check…Is this thing on?
Well if you’ve made it this far and you completely understand every bit we’ve gone over, that is wonderful. I’ll direct you to our careers page where you can submit an application to work for us.
If you got a little lost, don’t worry about it. These things take time and practice. The best thing you can do is practice. Or have a vendor, like Medisolv, help you with this process. Medisolv works with you through every step, from implementation and validation all the way to submission. Our expert consultants will hold your hand through the entire process.
If you are unsure of your hospital’s capability for implementation and submission, reach out to us. Medisolv can assist you with eCQM implementation, provide a software platform to view your eCQM data and will submit eCQMs on your behalf.





Add a comment