


By Erin Heilman June 3, 2022 Regulatory Updates: Hospital,Resource
I set off on a journey to create an article that helps quality leaders understand the CMS Care Compare website and its connection to other public reputation websites like Leapfrog. It turns out finding information about when this site is updated, the exact measures and timeframes used and when to expect preview information was unnecessarily complicated to find.
As a quality leader it’s incredibly important that you have a firm grasp on these items since your public reputation is at stake. The information placed on these sites reflects your quality of care to the public. To a consumer it looks like a Yelp review, but because it’s a government (authority) site your consumers assume 1) the data is an accurate reflection of the care they expect to receive at your facility and 2) the data is current. Honestly, I’m not sure anyone in healthcare would agree with both of those statements and most certainly not the last statement alone.
Today I’ll dive into how and when CMS populates their Care Compare website and how it’s connected to the Leapfrog Hospital Safety Grades site. I’ve made some resources for you to help going forward. If you’re ready, let’s go!
Overview
Care Compare is a public facing website that displays information about your hospital’s performance including a 1-5 Star Rating. It’s run by CMS and was previously called Hospital Compare.
Leapfrog is an independent group that also displays your performance publicly on their website Hospital Safety Grade.
You are probably somewhat aware that the measures you submit to the federal regulatory programs populate these public facing websites.
CMS uses your performance in these programs to populate Care Compare and the Star Ratings:
- Inpatient Quality Reporting (IQR) Program
- Outpatient Quality Reporting (OQR) Program
- Inpatient Psychiatric Facility Quality Reporting (IPFQR) Program
- Readmission Reduction Program (HRRP)
- Hospital-Acquired Condition (HAC) Reduction Program
- Hospital Value-Based Purchasing (HVBP) Program
Leapfrog Hospital Safety Grade uses data released from CMS and supplements the data with an annual Leapfrog Hospital Survey. If your hospital participates in this annual voluntary survey, Leapfrog will use this information to calculate your letter grade. If you don’t participate, it will only use the publicly reported CMS data. It is likely in your best interest to participate in the survey, and you’ll understand why below.
RESOURCE
I’ve made a pretty elaborate Excel cross walk for you. The first tab has all measures used for Care Compare and Leapfrog and the timelines of data currently used. The next two tabs contain information about which measures are used on the Care Compare website and the measures used for current Star Ratings.
|
Care Compare and Leapfrog Cross Walk [Download]
|
Mapping Quality Measures to Care Compare
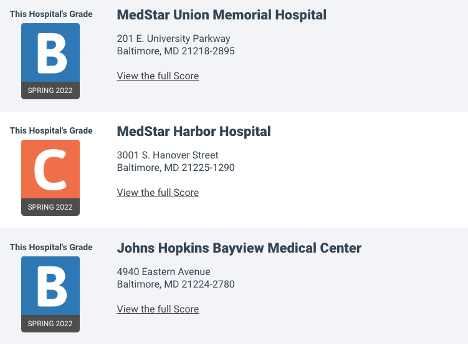
On Care Compare, you can enter your zip code or city/state and look up hospitals near you. I put in Baltimore, MD and up popped a list of surrounding hospitals.
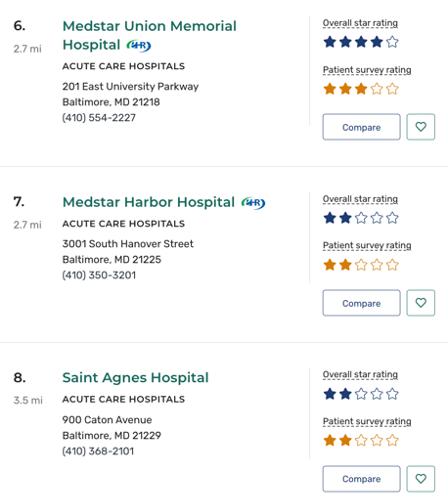
You’ll notice before I even dive into the details, I can quickly see which hospitals have a better Star Rating and Patient Survey Rating.
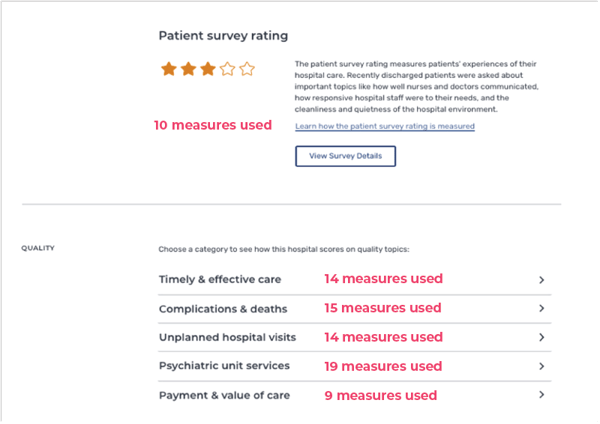
Once you click into the individual facility, you see the hospital’s Star Rating and Patient Survey Rating called out again. Then, as you scroll, you see five accordions that contain more quality performance information.
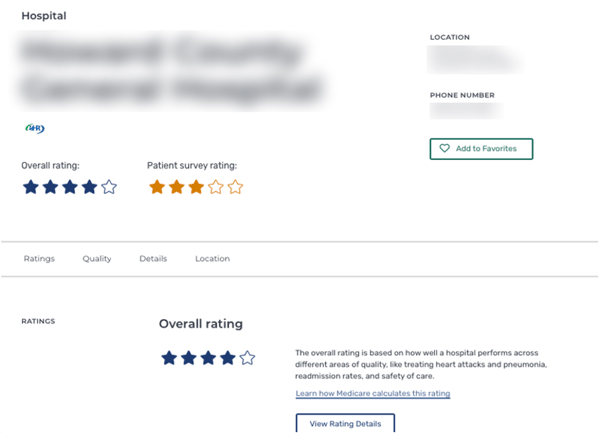
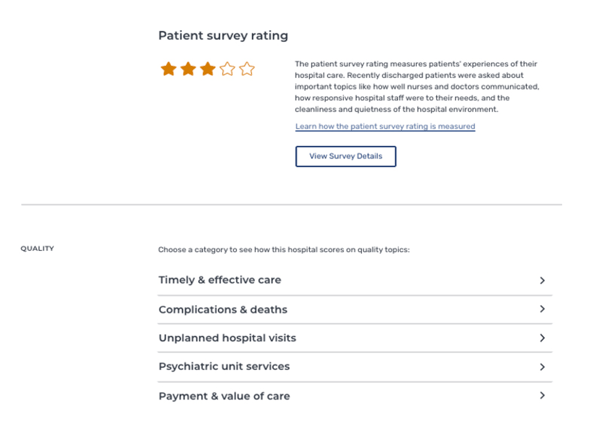
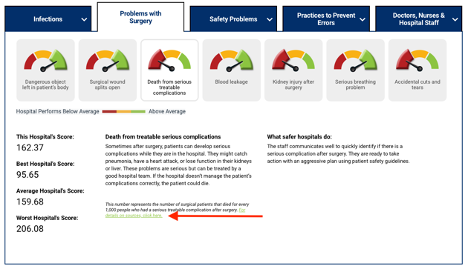
You can click any of those quality categories and it will open a window with details on your hospital’s performance. Once opened, you’ll see the list of measures that CMS publicly displays on Care Compare.
Let’s use an example. If we click the category “Complications & deaths” let’s look at the measure “Deaths among patients with serious treatable complications after surgery.”
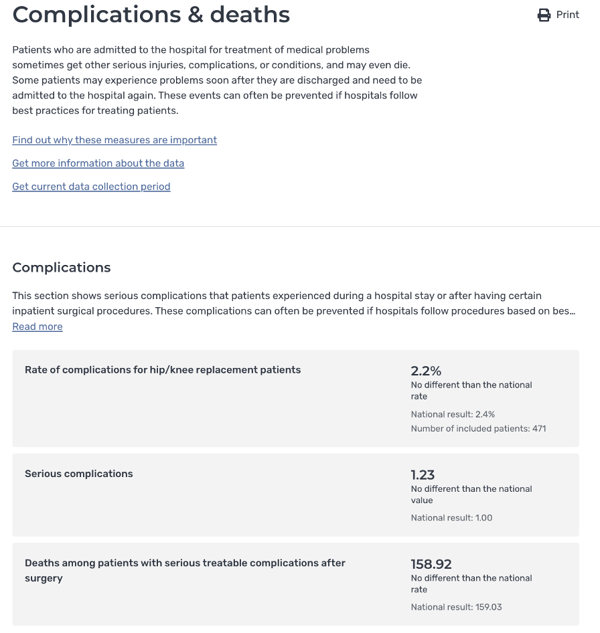
You know this measure as PSI-4, “Death among surgical inpatients with serious treatable complications rate.” CMS slightly alters the name to make it more consumer friendly.
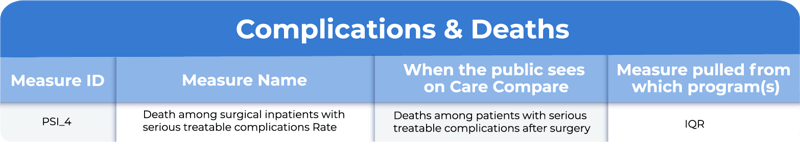
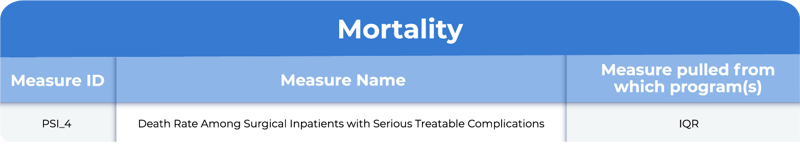
Below is a chart which shows you all measures in the “Complications & Deaths” category. You’ll see the measure ID as you know it, the measure name, what the public sees on Care Compare (in order of how they see it) and the program that the measure is pulled from. Download the full Excel sheet above for all measures by quality category.
Understanding Care Compare Timeframes
Now pay attention, this next part is important.
The PSI-4 measure currently displayed on Care Compare contains data from July 1, 2018 – December 31, 2019. You read that right. Your current public reputation is based on your performance pre-pandemic.
It’s important to know which measures are being displayed on Care Compare and it is as equally important to know the time frame of the data being displayed.
It’s not as easy to find that information from CMS. Here is the link: https://data.cms.gov/provider-data/dataset/4j6d-yzce.
And of course, each measure varies. Some measures have different timeframes. Again - reference that resource I gave you in the beginning.
Now let’s jump over to Leapfrog.
Leapfrog Hospital Safety Grade Measures
If you go to Hospital Safety Grades you have the same ability to search by zip code or geographic area. And once again, up pops of list of hospitals surrounding your area with a letter grade to give your patients an immediate judgement on the hospital’s performance.
If you click into the hospital information, you will see very similar information posted here. I’ve highlighted the same exact measure that you saw on Care Compare, PSI-4.
Leapfrog makes it easier to see the timeframes of the data. I’ve drawn an arrow to show you the link to click on your hospital’s page. It gives you the measure information, the source, and the dates.
Once again, PSI-4 is data pulled from CMS and the timeframe is July 1, 2018 – December 31, 2019. And that’s why it’s beneficial for you to participate in the annual, voluntary Leapfrog Hospital Survey so there’s at least some current information posted here. It doesn’t overwrite the CMS data, but it helps balance it out.
Star Ratings Measures
Ok, I’ve got just one more surprise for you. Let’s go back to CMS and look at the Star Ratings information. Remember your Star Rating is displayed at the very top in blue.

CMS calculates your Star Rating from a subset of the Care Compare measures. They break them into different categories than the general Care Compare measures. The categories and measure counts are below.
- Mortality (7)
- Readmission (11)
- Safety of Care (8)
- Patient Experience (8)
- Timely & Effective Care (14)
It’s a little more complicated to calculate your Star Rating. There is an average and a weighting system, and peer grouping. For more details on how CMS calculates your Star Rating, check out this article we posted.
Let’s find our PSI-4 measure again. It’s found in the Mortality category.
But in this case the date range used for your Star Ratings calculation for PSI-4 is July 1, 2017 – June 30, 2019. Boy, 2017 was a long time ago. Some measures used for the Star Ratings go back as far as 2016.
The data for Star Ratings is found in the reports which are updated, at this point, once a year. https://qualitynet.cms.gov/inpatient/public-reporting/overall-ratings/reports.
If you download that crosswalk I made for you it contains the measures by category for the Star Ratings calculation as well.
|
|
Care Compare and Leapfrog Cross Walk [Download]
|
Public Reporting Release Dates
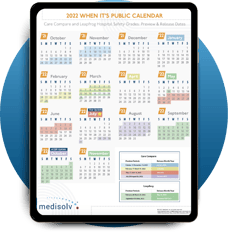
So, how can you keep all this straight? Well, I have another resource for you. I’ve created a 2022 calendar to help you keep on top of updates to the Care Compare and Leapfrog sites.
The basic schedule goes like this. Care Compare refreshes their website four times a year: January, April, July, October. Leapfrog releases their Hospital Safety Grades two times a year: once in the spring (May) and once in the fall (November).
As a quality leader, you get access to preview reports for both websites before they are published. You should use these preview reports to look for any discrepancies in the data and also share any good news (such as a 5-star or A rating) with your internal stakeholders and marketing teams. The preview periods are generally a couple months before the release. Someone in your quality department will get an email from CMS to let them know they are ready for review.
RESOURCE
This calendar shows you the preview periods and the release months for both Care Compare and Leapfrog Hospital Safety Grades.
|
When Its Public Calendar [Download]
|
Here’s the last thing you must know about Care Compare. Not all measures are released at the same time. I assumed the quarterly refreshes of Care Compare released all publicly reported data. Not so. If you look at the Excel resource I made for you, it contains a column identifying which month(s) each measure is released. Please note, the Star Ratings are not updated each quarter. In fact, CMS has only updated the Star Ratings once a year since their inception in 2017. Your updated Star Ratings will be released in July 2022.
In summary:
Your public reputation is being regularly released with or without your knowledge. The public is familiar with these types of rating systems and attributes authority to a website like Care Compare. The data is old at best, but your reputation is built on it, so you should know the data inside and out.
You should know which measures are used to populate what the public sees on Care Compare and Leapfrog. You should also understand the date ranges currently used so you can speak to it internally and to the public.
Use those preview periods to review the data before its released and ensure everything is accurate. Mistakes could unfairly, negatively affect your reputation.
Consider focusing your future quality initiatives on improving any public reputation measures that look especially bad online and be sure to share your results internally, so stakeholders understand the importance of your quality team’s initiatives and how they matter to your organization’s public reputation.
Resources
Preview Report Information
- Care Compare Preview Period Download:
- Star Rating Preview Download:
Time Periods of Data Used
- Care Compare:
- Star Ratings (Download the HUG):
- Leapfrog (look up on specific hospital page):
Medisolv Can HelpAlong with award-winning software, each client receives a dedicated Clinical Quality Advisor that helps you with your technical and clinical needs. We consistently hear from our clients that the biggest differentiator between Medisolv and other vendors is the level of one-of-one support. Especially if you use an EHR vendor right now, you’ll notice a huge difference.
|


Add a comment