

CMS released the 2024 star rating for nearly all U.S. hospitals. The hospital star rating system began nearly a decade ago and is updated at least once annually. It uses a familiar system of ranking hospitals according to a star rating, with a one-star indicating poor performance and a five-star indicating excellent performance.
But while the star rating may be easy for consumers to understand, the calculation used to assess and rate hospitals is anything but simple. Today we will review how this star rating was calculated and how hospitals performed in 2024.
- Jump to: How did CMS calculate the 2024 star rating?
- Jump to: How did other hospitals perform?
Which measures did CMS use for the 2024 star rating?
The star rating is made up of five categories: mortality rates, patient readmissions to the hospital, safety of care, timely and effective care, and the patient experience (as reported by patients). Within each category are a set of measures which you have submitted through your various regulatory programs or CMS has gathered through your claim submissions. Here are the measures and timeframes that were used to determine your 2024 hospital star rating.
|
Star Ratings Measure Group |
Measure ID |
Measure name |
Timeframe Used |
Measure pulled from which program(s) |
|
Mortality |
||||
|
MORT 30-AMI |
Acute Myocardial Infarction (AMI) 30-Day Mortality Rate |
7/1/19-6/30/22 |
HVBP |
|
|
MORT 30-CABG |
Coronary Artery Bypass Graft (CABG) 30-Day Mortality Rate |
7/1/19-6/30/22 |
HVBP |
|
|
MORT 30-COPD |
Chronic Obstructive Pulmonary Disease (COPD) 30-Day Mortality Rate |
7/1/19-6/30/22 |
HVBP |
|
|
MORT 30-HF |
Heart Failure (HF) 30-Day Mortality Rate |
7/1/19-6/30/22 |
HVBP |
|
|
MORT 30-PN |
Pneumonia (PN) 30-Day Mortality Rate |
7/1/19-6/30/22 |
HVBP |
|
|
MORT 30-STK |
Acute Ischemic Stroke (STK) 30-Day Mortality Rate |
7/1/19-6/30/22 |
IQR |
|
|
PSI 04 |
Death Rate Among Surgical Inpatients with Serious Treatable Complications |
7/1/20-6/30/22 |
IQR |
|
|
Readmission |
||||
|
EDAC 30 AMI |
Excess Days in Acute Care after Hospitalization for Acute Myocardial Infarction |
7/1/19-6/30/22 |
IQR |
|
|
EDAC 30 HF |
Excess Days in Acute Care after Hospitalization for Heart Failure |
7/1/19-6/30/22 |
IQR |
|
|
EDAC- 30 PN |
Excess Days in Acute Care after Hospitalization for Pneumonia (PN) |
7/1/19-6/30/22 |
IQR |
|
|
READM 30 CABG |
Coronary Artery Bypass Graft (CABG) 30-Day Readmission Rate |
7/1/19-6/30/22 |
HRRP |
|
|
READM 30 COPD |
Chronic Obstructive Pulmonary Disease (COPD) 30-Day Readmission Rate |
7/1/19-6/30/22 |
HRRP |
|
|
READM 30 HIP KNEE |
Hospital-Level 30-Day All-Cause Risk- Standardized Readmission Rate (RSRR) Following Elective Total Hip Arthroplasty (THA)/Total Knee Arthroplasty (TKA) |
7/1/19-6/30/22 |
HRRP |
|
|
READM 30 HOSP WIDE |
HWR Hospital-Wide All-Cause Unplanned Readmission |
7/1/19-6/30/22 |
IQR |
|
|
OP 32 |
Facility Seven-Day Risk-Standardized Hospital Visit Rate after Outpatient Colonoscopy |
1/1/20-12/31/22 |
OQR |
|
|
OP 35 ADM |
Admissions for Patients Receiving Outpatient Chemotherapy |
1/1/22-12/31/22 |
OQR |
|
|
OP 35 ED |
Emergency Department (ED) Visits for Patients Receiving Outpatient Chemotherapy |
1/1/22-12/31-22 |
OQR |
|
|
OP 36 |
Hospital Visits after Hospital Outpatient Surgery |
1/1/22-12/31/22 |
OQR |
|
|
Safety of Care |
||||
|
COMP HIP KNEE |
Hospital-Level Risk-Standardized Complication Rate (RSCR) Following Elective Primary Total Hip Arthroplasty (THA) and Total Knee Arthroplasty (TKA) |
4/1/19-3/31/22 |
HVBP |
|
|
HAI 1 |
Central-Line Associated Bloodstream Infection (CLABSI) |
4/1/22-3/31/23 |
HVBP, HACRP |
|
|
HAI-2 |
Catheter-Associated Urinary Tract Infection (CAUTI) |
4/1/22-3/31/23 |
HVBP, HACRP |
|
|
HAI-3 |
Surgical Site Infection from Colon Surgery (SSI-colon) |
4/1/22-3/31/23 |
HVBP, HACRP |
|
|
HAI-4 |
Surgical Site Infection from Abdominal Hysterectomy (SSI-abdominal hysterectomy) |
4/1/22-3/31/23 |
HVBP, HACRP |
|
|
HAI-5 |
MRSA Bacteremia |
4/1/22-3/31/23 |
HVBP, HACRP |
|
|
HAI-6 |
Clostridium Difficile (C.difficile) |
4/1/22-3/31/23 |
HVBP, HACRP |
|
|
PSI 90 |
Patient Safety and Adverse Events Composite |
7/1/20-6/30/22 |
HVBP, HACRP |
|
|
Patient Experience |
||||
|
H-COMP-1 |
Communication with Nurses |
4/1/22-3/31/23 |
IQR, HVBP |
|
|
H-COMP-2 |
Communication with Doctors |
4/1/22-3/31/23 |
IQR, HVBP |
|
|
H-COMP-3 |
Responsiveness of Hospital Staff |
4/1/22-3/31/23 |
IQR, HVBP |
|
|
H-COMP-5 |
Communication About Medicines |
4/1/22-3/31/23 |
IQR, HVBP |
|
|
H-COMP-6 |
Discharge Information |
4/1/22-3/31/23 |
IQR, HVBP |
|
|
H-COMP-7 |
Care Transition |
4/1/22-3/31/23 |
IQR, HVBP |
|
|
H-CLEAN-HSP/H-QUIET-HSP |
Cleanliness and Quietness of Hospital Environment |
4/1/22-3/31/23 |
IQR, HVBP |
|
|
H-HSP-RATING/H-RECMND |
Overall Rating of Hospital |
4/1/22-3/31/23 |
IQR, HVBP |
|
|
Timely & Effective Care |
||||
|
HCP COVID-19 |
COVID-19 Vaccination Coverage Among HCP |
1/1/23-3/31/23 |
IQR |
|
|
IMM-3 |
Healthcare Personnel Influenza Vaccination |
10/1/22-3/31/23 |
IQR |
|
|
OP 10 |
Abdomen CT Use of Contrast Material |
7/1/21-6/30/22 |
OQR |
|
|
OP 13 |
Cardiac Imaging for Preoperative Risk Assessment for Non-Cardiac Low-Risk Surgery |
7/1/21-6/30/22 |
OQR |
|
|
OP 18b |
Median Time from ED Arrival to ED Departure for Discharged ED Patients |
4/1/22-3/31/23 |
OQR |
|
|
OP 22 |
ED-Patient Left Without Being Seen |
1/1/22-12/31/22 |
OQR |
|
|
OP 23 |
ED-Head CT or MRI Scan Results for Acute Ischemic Stroke or Hemorrhagic Stroke who Received Head CT or MRI Scan Interpretation Within 45 Minutes of Arrival |
4/1/22-3/31/23 |
OQR |
|
|
OP 29 |
Endoscopy/Polyp Surveillance: Appropriate Follow-up Interval for Normal Colonoscopy in Average Risk Patients |
1/1/22-12/31/22 |
OQR |
|
|
OP 3b |
Median Time to Transfer to Another Facility for Acute Coronary Intervention |
4/1/22-3/31/23 |
OQR |
|
|
OP 8 |
MRI Lumbar Spine for Low Back Pain |
7/1/21-6/30/22 |
OQR |
|
|
PC 01 |
Elective Delivery Prior to 39 Completed Weeks Gestation: Percentage of Babies Electively Delivered Prior to 39 Completed Weeks Gestation |
4/1/22-3/31/23 |
IQR |
|
|
SEP 1 |
Severe Sepsis and Septic Shock |
4/1/22-3/31/23 |
IQR, HVBP |
|
OP-2 (Outpatients with chest pain or possible heart attack who received drugs to break up blood clots within 30 minutes of arrival) was excluded from the Star Rating because not enough hospitals reported the measure (<100 hospitals).
Additionally, CMS did modify some of the above timeframes based on COVID-19 impact to hospital performance. There were 14 measures that would normally include Q1 and Q2 2020 data but because of the pandemic they were excluded. Because of these changes, CMS calculated your star ratings using the majority of data to be reflective of your care after June 30, 2020.
How Did CMS Calculate the 2024 Hospital Star Rating?
The star rating calculation was simplified in 2021 and now is calculated in 10 steps.
STEP 1: Hospitals submit data to CMS quality programs
Your hospital submits measures to the CMS quality programs such as the Hospital IQR and OQR programs. Your measures are used to populate your performance on the value programs such as the Hospital Readmission Reduction Program (HRRP), HAC Reduction and HVBP programs. Sometimes you submit the measure (like SEP-1) and sometimes CMS collects the data from claims files.
STEP 2: CMS identifies which measures and timeframes to use
CMS selects which measures they will use to make the star rating score. The measures used in the 2024 star rating are listed above.
STEP 3: CMS standardizes the measure scores
CMS takes your hospital’s performance on those CMS-selected measures and standardizes the measure score, so it makes sense in the overall equation. Think about an inverse measure where lower scores are better. You wouldn’t want that score to count against a total score, so they standardize all measure scores. This method of standardizing is called Z-scoring.
Understanding Z-scoring
A Z score is statistical technique. It’s a standard deviation score which shows the amount of variation in a dataset. For the star rating, Z-scores were produced by subtracting the national mean score from each hospital’s measure score and dividing that by the standard deviation across hospitals. Standard deviation is a number that measures how far data values are from their average.

In addition to that, CMS changed the direction of all inverse measures to reflect better performance for those lower scores.
STEP 4: Measures are grouped
The measures are put into groups based on the category. The five measures groups are:
- Mortality
- Safety of Care
- Readmissions
- Patient Experience
- Timely and Effective Care
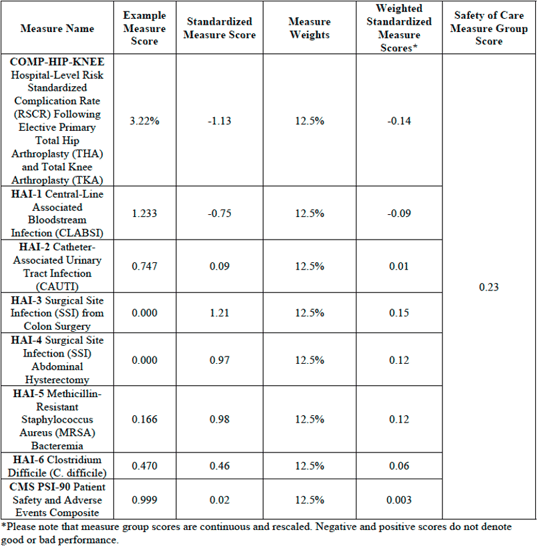
STEP 5: CMS calculates the measure group score using a simple average
In each measure group, CMS will calculate a simple average to determine a measure group score. A simple average takes the sum of measures with equal weights and divides by the number of measures a hospital reports.
For example:
There are 8 measures in the Safety of Care category.
100 divided by 8 is 12.5 so each of the 8 measures in this category would be worth 12.5% of the overall Safety of Care category score.
100% / 8 measures = 12.5%
Measure group score (based on example above) =
[(-1.13*0.125) + (-0.75*0.125) + (0.09*0.125) + (1.21*0.125) + (0.97*0.125) + (0.98*0.125) + (0.46*0.125) + (0.02*0.125)] = 0.23
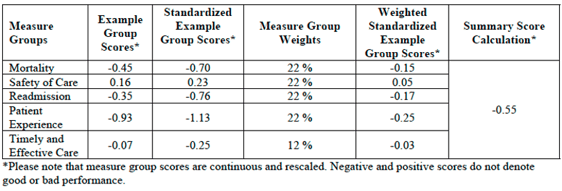
STEP 6: CMS applies a weight to each group score
Not all categories are weighted evenly. A weight is applied to that measure group score. Your final score is calculated according to the weight of the category. The weights for the five categories are as follows:
- Mortality = 22% weight
- Safety of Care = 22% weight
- Readmissions = 22% weight
- Patient Experience = 22% weight
- Timely and Effective Care = 12% weight
For Example:
Summary score = [(-0.70*0.22) + (0.23*0.22) + (-0.76*0.22) + (-1.13*0.22) + (-0.25*0.12)] = -0.55
STEP 7: Hospitals are excluded, or their score is re-weighted depending on the number of measures submitted
Not all hospitals submit (or have enough claims) to qualify for every measure in all five categories. A hospital must report at least three measure groups with at least three measures in each group, (must include groups Mortality or Safety of Care) in order to receive a star rating. Once the minimum measure and measure group thresholds are met, any additional measures a hospital reports would be included in the star rating calculation.
Let’s say you met the minimum threshold, but you didn’t have any measures that were able to be calculated in the Timely and Effective Care category. That measure group is subtracted from the total.
For Example:
100 (100-12=88)
Mortality weight: 22/88 = 25%
Safety of Care weight: 22/88 = 25%
Readmission weight: 22/88 = 25%
Patient Experience weight: 22/88 = 25%
Example of Reweighting for a Hospital Which Does Not Report Timely and Effective Care Measure Group
![ReweightingNoTimelyCareScoreStarRating[88]](https://blog.medisolv.com/hs-fs/hubfs/ReweightingNoTimelyCareScoreStarRating%5B88%5D.png?width=540&height=233&name=ReweightingNoTimelyCareScoreStarRating%5B88%5D.png)
STEP 8: Hospitals are put into one of three peer groups based on the number of measures they submitted
Hospitals are put into one of three peer groups depending on how many measures they submit or are calculated. CMS believes that by grouping hospitals by how many measure groups they report, this will help capture key differences between hospitals like size, patient volume, case mix and service mix. Larger hospitals, for example, generally submit the most measures and smaller hospitals submit the fewest.
The three peer groups are:
- Five measure groups submitted
- Four measure groups submitted
- Three measure groups submitted
STEP 9: Within the peer groups, scores are split into 5 groups using the k-means clustering method
Within the peer grouping, scores are split into five groups using the k-means clustering method. Essentially the k-means clustering is an algorithm method which aims to make hospital scores results within a cluster more similar to each other than to a different cluster.
STEP 10: Whichever group your score puts you in becomes your star rating
Whichever k-means clustering group your score puts you in becomes your star rating.
Note: Since hospitals in a peer group are being compared only to each other that means hospitals with the same score, but a different peer group, could receive different star ratings.
How Did Other Hospitals Perform?
There were 2,847 hospitals who received a star rating in 2024 as compared to 3,076 hospitals in 2023.
This year:
- 277 (10%) got 1 star
- 595 (21%) got 2 stars
- 828 (29%) got 3 Stars
- 766 (27%) got 4 stars
- 381 (13%) got 5 stars
The distribution of star ratings is similar to the distribution in 2023.

Medisolv had 145 of the 381 5-star hospitals. Congratulations to all of our 5-star hospitals listed below.
How to Improve Your Star Rating
If you made it this far down in the article, congratulations; you are one step closer to improving your star rating. Simply by understanding how the star rating is calculated and what timeframes they consider will help you to understand what to focus on.
It comes down to ensuring you are doing everything you can to improve your performance across the major regulatory programs I mentioned in Step 1: Hospital IQR, OQR, HRRP, HACRP and HVBP programs.
These measures are used for more than just star rating calculation, they are publicly reported on Care Compare. The public facing website contains not just the measures from your star ratings, but a whole host of additional measures submitted in those regulatory programs. Furthermore, the Care Compare measures are used, at least in part, for almost every public hospital ranking program today. Some popular programs are the U.S. World and News Reports for Best Hospitals and the Leapfrog Hospital Safety Grades which assigns letter grades for all hospitals.
The number of stars and your public performance may influence the credibility, efficiency, culture, and financial state of your organization.
Congratulations to Medisolv's 5-Star Hospitals:
|
Abbott Northwestern Hospital |
MidState Medical Center |
|
Alta View Hospital |
Milford Regional Medical Center |
|
American Fork Hospital |
Miriam Hospital |
|
Baptist Medical Center Nassau |
Missouri Baptist Medical Center |
|
Baptist Memorial Hospital - Leake |
Morristown Medical Center |
|
Baptist Memorial Hospital - Union County |
Mount Auburn Hospital |
|
Barnes-Jewish St Peters Hospital |
MyMichigan Medical Center Alpena |
|
Bellevue Medical Center |
NewYork-Presbyterian Queens |
|
Bellin Hospital Green Bay |
NewYork-Presbyterian Weill Cornell Medical Center |
|
Beth Israel Deaconess Hospital - Milton |
North Texas Medical Center |
|
Boone County Hospital |
Northwestern Medicine Central DuPage Hospital |
|
Brigham and Womens Hospital |
Northwestern Medicine Delnor Hospital |
|
Bryan East Campus |
Northwestern Medicine Kishwaukee Hospital |
|
Bryn Mawr Hospital |
Northwestern Medicine Lake Forest Hospital |
|
Buffalo Hospital |
Northwestern Medicine McHenry Hospital |
|
Cambridge Medical Center |
Northwestern Memorial Hospital |
|
Carilion Giles Community Hospital |
Novant Health Mint Hill Medical Center |
|
Carle BroMenn Medical Center |
OhioHealth Dublin Methodist Hospital |
|
Carle Health Proctor Hospital |
OhioHealth OBleness Hospital |
|
Cary Medical Center |
OHSU Hospital - Portland |
|
Central Montana Medical Center |
Oklahoma Heart Hospital North |
|
Community Memorial Hospital - Ventura |
Oklahoma Heart Hospital South |
|
Corewell Health Butterworth Hospital |
Park City Hospital |
|
Corewell Health Gerber Hospital |
Porter Medical Center |
|
Corewell Health Zeeland Hospital |
Prairie Lakes Healthcare System |
|
Coryell Memorial Hospital |
Pratt Regional Medical Center |
|
Cox Monett Hospital |
Prisma Health Patewood Hospital |
|
Crossing Rivers Health |
Progress West Hospital |
|
Dignity Health Arizona General Hospital - Mesa |
Putnam County Hospital |
|
Doylestown Hospital |
Riverton Hospital |
|
Duke Raleigh Hospital |
Ronald Reagan UCLA Medical Center |
|
Duke University Hospital |
Rush Oak Park Hospital |
|
Emanuel Medical Center |
Rush University Medical Center |
|
Emerson Hospital |
Saint Lukes East Hospital |
|
Essentia Health - Duluth |
Saint Lukes Hospital of Kansas City |
|
Essentia Health - Fargo |
Saint Lukes South Hospital |
|
Essentia Health - St Marys Medical Center |
Salinas Valley Health |
|
Evanston Hospital |
Sanford USD Medical Center |
|
Exeter Hospital |
Santa Barbara Cottage Hospital |
|
Goleta Valley Cottage Hospital |
Sentara Martha Jefferson Hospital |
|
Good Samaritan Hospital |
Sentara Obici Hospital |
|
Grant Memorial Hospital |
Sharp Grossmont Hospital |
|
Greater El Monte Community Hospital |
Shenandoah Memorial Hospital |
|
Greene County General Hospital |
South County Hospital |
|
Hackensack University Medical Center |
Southwestern Vermont Medical Center |
|
Hedrick Medical Center |
Sparrow Eaton Hospital |
|
Holy Rosary Healthcare |
St George Regional Hospital |
|
Howard Young Medical Center |
St Lukes Boise Medical Center |
|
INTEGRIS Health Grove Hospital |
St Tammany Health System |
|
Intermountain Health Good Samaritan Hospital |
St Vincent Healthcare |
|
Intermountain Health Saint Joseph Hospital |
Surgical Hospital at Southwoods |
|
Intermountain Medical Center |
The Outer Banks Hospital |
|
IU Health North Hospital |
The University of Kansas Hospital |
|
Kansas Surgery & Recovery Center |
The University of Vermont Medical Center |
|
Keck Hospital of USC |
ThedaCare Medical Center - Berlin |
|
Lahey Hospital & Medical Center - Burlington |
Tisch Hospital |
|
LDS Hospital |
UC San Diego Medical Center |
|
Lee Memorial Hospital |
UCHealth Medical Center of the Rockies |
|
Logan Regional Hospital |
UCHealth Poudre Valley Hospital |
|
M Health Fairview Woodwinds Hospital - Woodbury |
UCHealth University of Colorado Hospital |
|
Massachusetts General Hospital |
UCLA Health - Santa Monica Medical Center |
|
Mayo Clinic Health System - Albert Lea |
UCSF Helen Diller Medical Center at Parnassus Heights |
|
Mayo Clinic Health System - Eau Claire |
UM St Joseph Medical Center |
|
Mayo Clinic Health System - La Crosse |
UNC Medical Center |
|
Mayo Clinic Health System - Mankato |
UNC Rex Hospital |
|
Mayo Clinic Health System - Northland in Barron |
University Hospital |
|
Mayo Clinic Health System - Red Cedar in Menomonie |
University of Utah Hospital |
|
Mayo Clinic Hospital - Arizona |
UP Health System - Portage Main Campus |
|
Mayo Clinic Hospital - Florida |
Utah Valley Hospital |
|
Mayo Clinic Hospital - Saint Marys Campus |
Watauga Medical Center |
|
McKay-Dee Hospital |
Whittier Hospital Medical Center |
|
Memorial Hermann Sugar Land Hospital |
Winchester Hospital |
|
Methodist Hospital Hill Country |
Wooster Community Hospital |
Sources:
i. https://public-inspection.federalregister.gov/2020-26819.pdf
ii. https://www.aha.org/system/files/media/file/2020/12/cms-issues-hospital-outpatient-asc-final-rule-including-maintenance-340b-cuts-bulletin-12-3-20.pdf
iii. https://www.sheppardhealthlaw.com/2020/12/articles/centers-for-medicare-and-medicaid-services-cms/new-criteria-hospital-quality-star-rating/
iv. https://qualitynet.cms.gov/inpatient/public-reporting/overall-ratings/data-collection
v. https://www.qualityreportingcenter.com/globalassets/iqr2024events/iqr042524/2024-npc-slides_for-cms-clearance_updated_4.17.24_508.pdf
|
Ready to Improve Your CMS Hospital Star Rating? Understanding your score is just the first step. Improving it requires clarity, strategy, and the right tools. Start with insight. Medisolv’s Free Hospital Star Rating Assessment Tool gives you an instant breakdown of your CMS calculation. Simply upload your Hospital Specific Report (HSR) and receive:
Try it free: Ready for deeper intelligence? Watch the Analyzer demo on-demand and see how it works in action. |


Comments