What Makes Up an eCQM

Electronic Clinical Quality Measures, or eCQMs, have been gaining in popularity for several years now. We hear thought leaders say that we are moving into the 21st century by modernizing our technologies and using electronic documentation to capture and report on the quality of care at our hospitals.
Often though, thought leaders are just that, taking charge and leading our thoughts. They live somewhere up in the cloud with Google, I think. For those of us planted firmly on the ground, we want to know the details. How do eCQMs work and what do I need to understand in order to get my hospital up and running or become more proficient?
In this week’s blog, we take a look at what makes up an eCQM. What are the parts that make up an eCQM specification and how is that used in your hospital?
Chart-Abstracted Measures vs eCQMs
One of the first challenges that we often see our hospitals struggle with is understanding the difference between your chart-abstracted measures and your eCQMs. It’s completely different in the eCQM world. Your first step to understanding eCQMs is to recognize the difference in how the two measures are captured and calculated.
How to process chart-abstracted measures
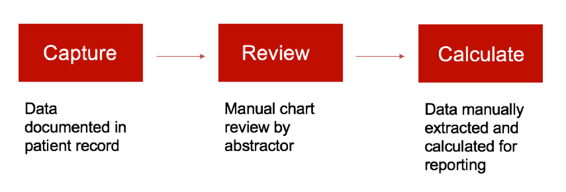
Manual abstraction, not unlike eCQMs, starts with data capture. That data can be captured anywhere. It can be electronic or on paper. Once captured, that data is reviewed manually by a hospital abstractor. After manual abstraction is completed, hospitals can calculate the data for internal review or reporting. The process as outlined below is pretty simple from that perspective.
How to process eCQMs
On the flip side, eCQMs have much more set up involved before you can even start capturing the data. The eCQM implementation process can be quite long depending on where you are in the process and depending upon the resources that are available to you. Once the implementation is completed, then you can build the system and implement the mapping.
The next step is the data capture process. This is when you will notice a big difference between your chart-abstracted measures and eCQMs. All eCQMs must be captured electronically in the EHR as structured data. It must also be documented in a way where it can be captured in a database of some kind and mapped. It cannot be free text notes, comments or any of those types of clinical documentation.
All of that captured data is then extracted electronically and reported in whatever reporting solution you’re using. You should be able to see the output of those reports so you can move to the next step, which is ongoing monitoring and improvement of those results.

Also see: Medisolv’s ENCOR software for capturing and reporting eCQMs
eCQM Specifications
The first thing you will want to do when starting to explore and learn about eCQMs is to download copies of the specifications (specs). You can download the spec sheets from the CMS website here.
All of these specs are set up similarly, but have different elements and requirements depending on which measure you are looking at.
Each measure specification will have the following components:
- Intent
- Populations
- Logic
- Data Elements
- Value Set Identifiers (OID)
For our example today, we are going to look at the NQF 441 or Stroke 10 eCQM spec.
I suggest downloading this file as a practice eCQM spec. Print it out and use a highlighter to locate and identify the different parts of this spec.
Download the NQF 441 Spec Sheet
Intent
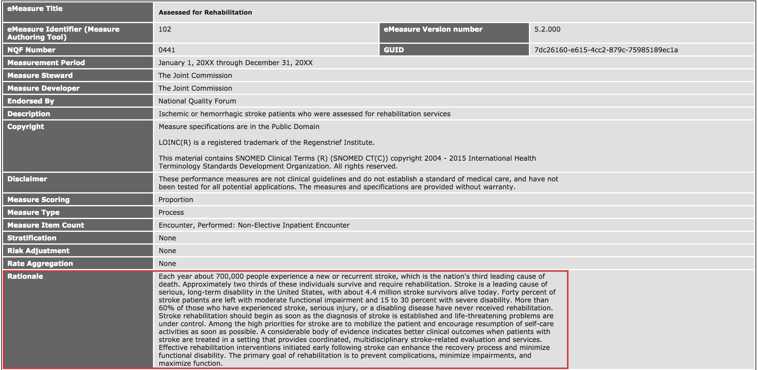
The first thing I want to point out in this image is the logic intent or rationale. Read through and highlight the rationale statement to understand the purpose of the measure. What is it trying to accomplish and what are the reasons behind it? While it may be back to this thought leader, pie in the sky type of thinking, it’s a good place to start when you are first making the decisions as to which eCQMs you would like to capture.
Populations
In order to truly understand what’s required of you to set these measures up correctly, you have to study the logic. The next items I want to draw attention to on this spec sheet are the several places that explain the populations for the measure.
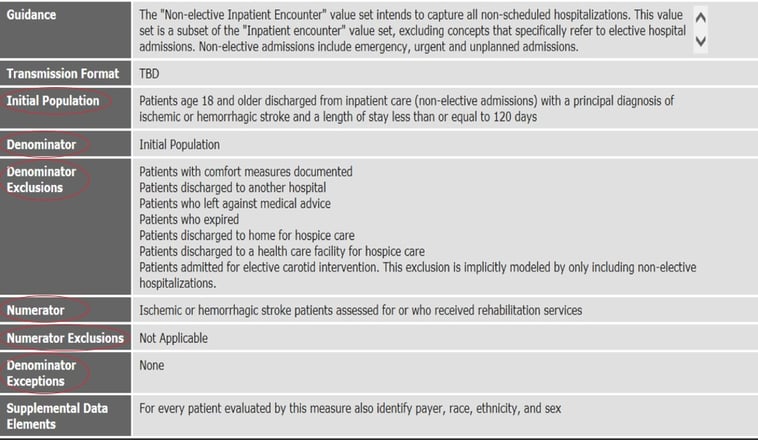
These components give you an understanding of how a patient would be counted, pass or fail the measure. Review the Initial Population (also known as the Initial Patient Population). Also review the Denominator, which tells you what has qualified the patient to be counted in the Denominator. In this case, it’s easy because it’s just whether or not they meet the Initial Population. Next, review the Numerator section. This will tell you the conditions under which the patient would pass the measure. And finally, review the Denominator and Numerator exclusions and Denominator Exceptions.
Logic
After you have set up your EHR to appropriately capture eCQMs, the logic outlined in this spec is applied to each of these populations to assess the patient for one of these populations. It is evaluated pretty much in order with what you see here. The patient is evaluated for the Initial Population first followed by the Denominator. Then, any patients meeting the Exclusions are removed from the Denominator population. The remaining population is evaluated for the Numerator, and then the rest would be evaluated for Exceptions if there are any. Patients would fail the measure if they did not meet any of those categories.
See if you can follow along with the logic in the spec as it explains how the patient is evaluated.
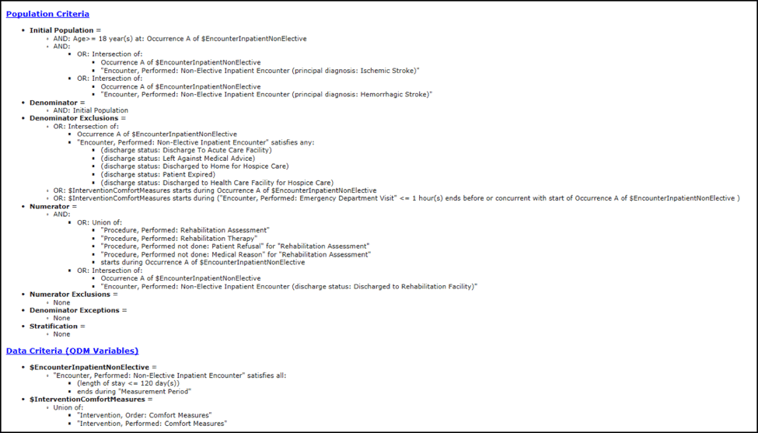
The logic as you see pictured here is called Boolean logic. The easiest way to look at this type of logic is to see every statement in each population as a true or false statement.
Was the patient over the age of 18? True or False.
Was it an inpatient? True or False.
Was it a non-elective visit? True or False.
Did they have a stroke? True or False.
Take some time right now to go through all of the logic in this spec and think about it that way. This will help you to understand these measures.
Data Elements
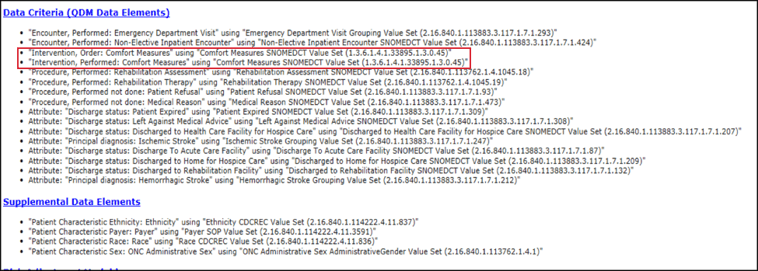
At the bottom of every spec, you’ll find a list of the data elements. Each of these data elements are key to the evaluation of the data as we reviewed above. And just about every data element within a measure requires mapping. If you are missing your mapping, for instance, on comfort measures, that is not going to get evaluated even if it is documented 20 times by clinicians. Pay attention to these data elements and be prepared to capture that data and have all of that mapping in place.
Value Set Identifiers (OID)
In the same section that you see the data elements, you’ll also find the OID or Value Set Identifiers. The OID code is the long number to the right of the data elements. You use this OID to look up the acceptable codes to map in your EHR in order to accurately capture the eCQM.
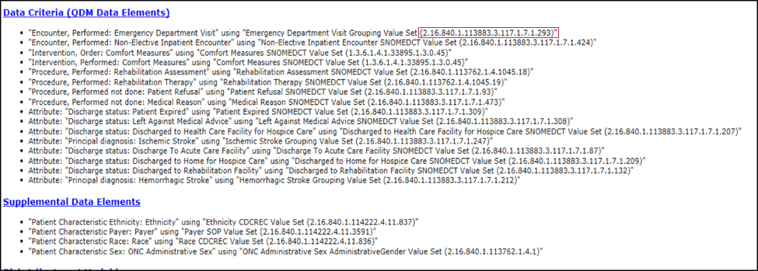
I suggest using the Value Set Authority Center (VSAC) website to look up the list of acceptable codes. Copy the OID from the spec and do a simple search on this website. If you do not have access to VSAC or do not have a good resource for your value sets, I would suggest you go ahead and register with VSAC. It’s a free and easy way to look up the value sets and all of the items that are included as qualifiers within that value set.
When searching, make sure that you select the correct version of the value set. They usually change these spec versions at least once a year.
In our example, we are attempting to capture in the EHR the medical reason why a patient did not have their rehab assessment completed. This follows along with the logic we outlined above that will help evaluate the patient for any exclusions.
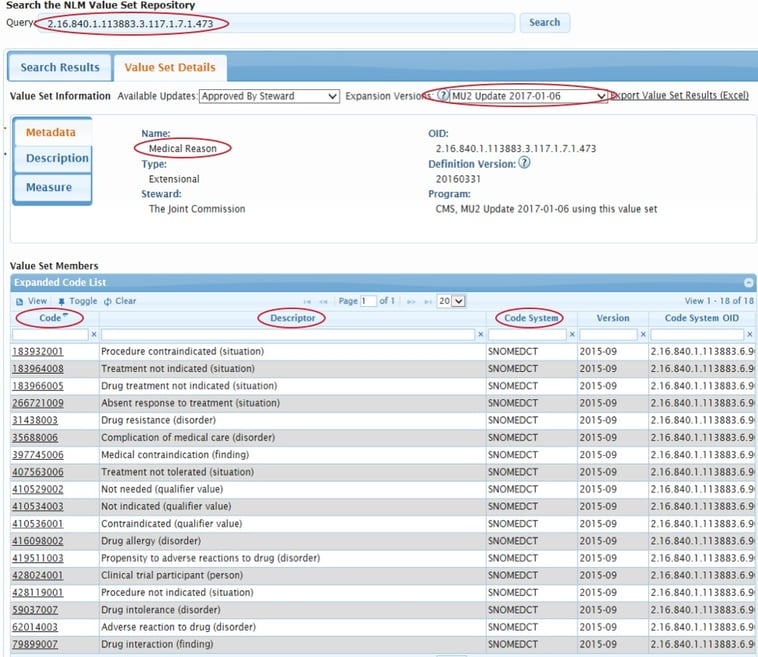
You’ll see all of the different descriptions on this page. You must then align those descriptions with your current documentation. So, if you currently have a clinical documentation field in place to capture the reason for no rehab assessment, you would just need to make sure you map codes from this value set to that current documentation. Or maybe you don’t have any documentation because your physical therapists document in paper. You would then need to build clinical documentation in your EHR to capture this. And it may be that you have documentation available, but maybe the wording isn’t exactly in alignment with this. In that case, you must make some updates to get it set up properly.
You don’t have to map all of the codes you see on that page. Review the value set and select the codes and descriptions that best align with your clinical workflow and your processes in your hospital.
Using the eCQM specifications as a resource during the planning process as well as throughout data validation and analysis, will ensure successful implementation and improve results. And remember, the best thing you can do to understand eCQMs is to study that logic.
Stay up-to-date:
Download our eCQM Preparation Checklist for 2019 Reporting
This FREE eCQM Reporting Checklist will walk you through the IQR program requirements. You’ll see step-by-step how to test and submit your quality data.
This eCQM Reporting Checklist Includes:
- CMS IQR program reporting requirements
- Step-by-step instructions on testing and submission
- Resources to help you with your submission

.png?width=352&name=2026%20Quality%20Reporting%20Deadlines%20Guide%20(1).png)


Comments