
How fit is your data? And what does it mean to have ‘fit’ data?
To understand data fitness, you need to first have a good understanding of data quality. A helpful and well-adopted definition of data quality throughout the data quality industry is the fitness to the purpose of use. In other words, the way that you use certain measures, analytics or reports defines its quality or integrity. So when it comes to evaluating your health care organization’s data fitness, you need to think about how fit each data element is for its ultimate purpose.
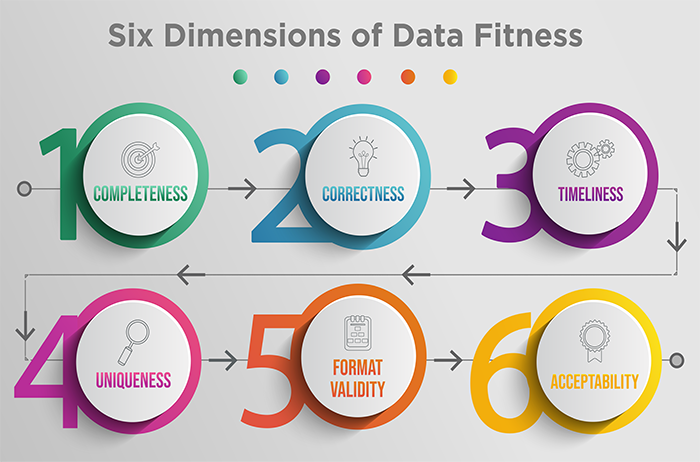
In a previous post, I broke down the five stages of data quality maturity. Today, I will review six dimensions of data fitness. Keep in mind that these are six basic dimensions of data fitness, and that there are other dimensions that could apply to your organization depending on the framework that you choose to use.

Completeness is defined as the proportion of data that is captured and stored against the potential of 100%. Completeness is typically easy to measure for both electronic data such as information captured in an EMR or a hospital registration system, as well as data that is manually collected by a reviewer on a form or survey.
The first step to achieving the highest possible level of completeness is to ensure that your data elements are clearly defined within the context of the measures in which they will be used. For example, if you were to measure average length of stay in the Emergency Department, arrival time would be a critical data element. While arrival time may seem like a relatively simple and straightforward data element to capture, there are typically multiple sources in which this data element exists, including sign in boards at the registration desk when walk in patients first arrive, nursing assessment forms, physician assessment forms and the hospital admission-discharge-transfer (ADT) system. The primary allowable source of arrival time needs to be specified, as well as any secondary sources where arrival time may be collected if it is missing from the primary source. Not all data elements will have allowable secondary sources as it depends on the consistency of data from the primary source.
Finally, a threshold for minimum allowable missing data needs to be established for each data element. Thresholds are determined by the impact of missing data. For example, if 30% of records are missing arrival time, 30% of patients would not be included in the ALOS measure. It is helpful to examine records where missing data exist in order to identify any patterns which could change the definition of the data element. So, if the missing arrival time was primarily occurring for patients that arrived via ambulance, then establishing an additional allowable source of data such as the ambulance transfer form may reduce or eliminate the missing data problem.

Correctness is the degree to which the data is true. Is it plausible? Does it make sense? Is there concordance with other sources of information that are similar? Consider the data element smoking history. A nursing assessment form might indicate that a patient smokes a pack per day, while the physician’s note may say that the patient denies a history of smoking. This is lack of concordance, and it's difficult to know for sure which is correct without further investigation. Establishing a periodic review of a random set of records to evaluate correctness is important, particularly for data elements in which there are multiple locations for the same information. For example, surgery start time may be recorded by the anesthesiologist, the OR nurse and the surgeon’s operative report. The primary allowable source of data should be periodically compared to other sources of information to evaluate correctness.
Correctness is particularly important to evaluate for data elements that are used in regulatory measures and undergo validation by CMS. This type of review is often referred to as inter-rater reliability, where two different reviewers collect information and compare their results. Like completeness, thresholds for mismatches between reviewers may be set to ensure the highest degree of correctness in your measurement process.

Timeliness is the degree to which the data represent reality from a required point of time, and the degree of timeliness is dependent on the context in which the measure results are used by quality management professionals or clinicians. Retrospective measures, such as mortality rates, are often compiled with data that becomes available in the discharge abstract three to five days after patients are discharged and the record has been coded for billing. The timeliness requirement of five days for the data element, discharge disposition, may be adequate within the context of mortality rate, however, within the context of measures for unplanned readmissions, five days may be too late to be actionable.
Timeliness is particularly important to evaluate for data elements used in predictive analytics and clinical decision support rules, which require clinician intervention in order to affect the desired outcome. In this context, it is important to work closely with your IT department to validate that data occurring in real time is being captured and stored in the analytic software at or near the same time. A time motion study can be useful to compare work flow and data flow, as well as to understand potential variations in the timing of data capture. Take for example the data element systolic blood pressure used in predictive analytics to identify patients whose condition is rapidly declining on a medical surgical unit. One nursing unit may record vital signs for individual patients in the bedside EMR immediately after they are taken, while another nursing unit may record them on a clipboard and enter them in batch to the EMR 30 to 90 minutes after all patients on the unit have been assessed. Your IT staff may confirm that the data is streaming across the interface and may have near perfect completeness thresholds, but you will never know that the information is lagging until you conduct a time motion study of clinical workflow and compare the time in the database.

Uniqueness is an important dimension to consider when it comes to patient-centric data. It pertains to the unique identifiers or numbers assigned to each patient, encounter or visit. While most HIT systems have unique medical record and account numbers, problems can occur when records are being sent from one IT system to another. For example, a patient arrives via ambulance to the ED and is entered into the EMR as John Smith so that emergency care can begin. Later, when the patient was transferred to the nursing unit, the admissions clerk receives the insurance card and enters the patient into the hospital registration system as Robert Johnathon Smith. These entries are known as duplicates and can occasionally create measurement havoc.
Your IT system is largely responsible for monitoring and resolving these types of transaction errors, however, quality professionals should periodically drill down to patient-level detail and examine records for duplicates to ensure the measure is performing as designed. Looking for records with the same birthdate or arrival time can sometimes uncover duplicates that were not resolved between the sending and receiving IT systems. Once duplicates are resolved, the quality management team needs to provide guidance to the IT department about how far back measures impacted by duplicates need to be refreshed. Some sophisticated performance measurement systems like Medisolv can even tell you what measures the individual patients or encounters qualified for so that you can be assured all issues have been addressed prior to regulatory submission.

Format validity is the degree to which data conform to the required format, type and range. This is also known as syntax. While most codes such as ICD-10 codes, MS-DRG codes, CPT-4 codes or SNOMED codes all have nationally adopted codes, different IT systems may use different formats in the interfaces that move this information from point to point. For example, one system may use a decimal point in an ICD code, where others do not. Likewise, some systems allow for leading zeros, while others do not.
Similar to uniqueness, ensuring format validity is largely the responsibility of your IT department. But quality professionals need to be on the lookout for changes in their measurement results, particularly when transitioning from one HIT system to another. In one example, a hospital was monitoring their performance in patient safety using the AHRQ PSI-90 Composite measure. The measure ratio was reported to the board of directors monthly. Six months after their EMR conversion from Cerner to Epic, an astute quality analyst noted that the denominator of the individual AHRQ PSI measures had dramatically changed. Where once there were nearly 400 encounters, there were now 40! This change was a simple matter of correcting the format of the MS-DRG codes sent into Epic. Once corrected, the PSI-90 measure was reprocessed back three years to ensure accurate information could be reported for all measures using MS-DRG in their measure logic.
Finally, periodic review and updates of coding taxonomies need to be conducted to ensure the proper code tables are updated to align with national standards. This annual to semi-annual review task may be delegated to an informatics specialist, a medical records coder or an IT analyst, however, quality professionals should review any codes that have been changed in order to understand the potential impact on measures the organization is stewarding. Medisolv conducts annual measurement review sessions with each of their clients, where attendance by both quality and IT stakeholders is highly encouraged.

Acceptability is the degree to which data is acceptable to end users and stakeholders, and is perhaps the most important dimension of data fitness. Without a high degree of acceptability, receivers of the information won’t understand or trust the data and take actions that are necessary to improve performance.
Measure acceptability is certainly in the wheelhouse of the Quality professional. To promote a high degree of acceptability, you need to first identify all the stakeholders tied to the measure. Next, carve out an educational plan for the stakeholders. While many measures are shared from the board to the bedside, each audience may require different levels of detail. All stakeholders should know the measure name and have access to a high-level measure definition that explains what is being measured. If the measure has a numerator and a denominator, clinicians are likely to require greater detail about the inclusion and exclusion criteria. Measures used to evaluate medical provider performance need particular attention to detail. Providers need to understand how and when measures are attributed to their practice, as well as any risk adjustment that is applied to the measure. Quality leaders should ensure there is a safe and non-punitive process in place for providers to validate and even question the data.
All stakeholders need to understand the rationale for why the organization is committing resources to steward the measure. When possible, communicate desired thresholds for performance and be explicit about what actions will be taken when performance falls below desired levels. While some measures are tied to regulatory requirements and financial penalties, the vast majority of measurement is tied back to the organization’s annual performance improvement plan. Organizations with a strong culture of quality and patient safety typically invest heavily in a comprehensive array of measures with a robust data quality governance structure, and may even tie bonuses for business and clinical leaders when established benchmarks are reached. Finally, measures should have a clearly defined “process owner” who is ultimately responsible for ensuring all stakeholders have been kept informed of the measure results and the performance improvement plan that may result for sub-optimal performance.
Be sure to stay tuned for a future post where I’ll dive into the six root cause of poor data fitness.
Remember, Medisolv is dedicated to helping clients improve and better manage their data quality through repeatable, reliable and verifiable data quality processes. We also have clinical experts who provide ongoing performance improvement support for a wide range of measures, including eCQMs and chart-abstracted measures.
Start turning your data into actionable information to improve clinical outcomes. Send us a note today.
Stay Ahead of the Quality CurveMedisolv Can Help Medisolv’s Value Maximizer software, uses machine learning and predictive modeling to forecast your future years payments in the CMS hospital quality programs (HAC, HVBP, HRRP). Our simulation guides your team on how to optimize your performance to maximize your reimbursements. Here are some resources you may find useful.
|


Comments