COVID Mortality Analysis of 547 Medisolv Hospitals Over Nine Months

As COVID-19 cases continue to tax hospitals, we felt it was worth diving into the data to see if there were any insights for quality departments. We pulled positive COVID-19 cases from 547 of our client hospitals during a nine-month period spanning April through December 2020.
The following graphics provide you with some of the major takeaways we found for quality directors, managers and leaders working in hospitals and health systems.
An important note about the data
The data you’re about to see is not risk-adjusted. So, when you’re looking at the mortality rate for hospitals with 50 beds compared with hospitals with 400 beds, just know that we don’t account for how sick patients were at Hospital A versus Hospital B and so on. This is just straight raw numbers.
We felt that the data was interesting enough by itself that we wanted to share it with our blog readers in case it gives you any little insight.
An Overview of the Data
Here is the summary of the COVID data we pulled.
Four Takeaways for Quality Leaders
While reviewing this data keep in mind this is not risk-adjusted.

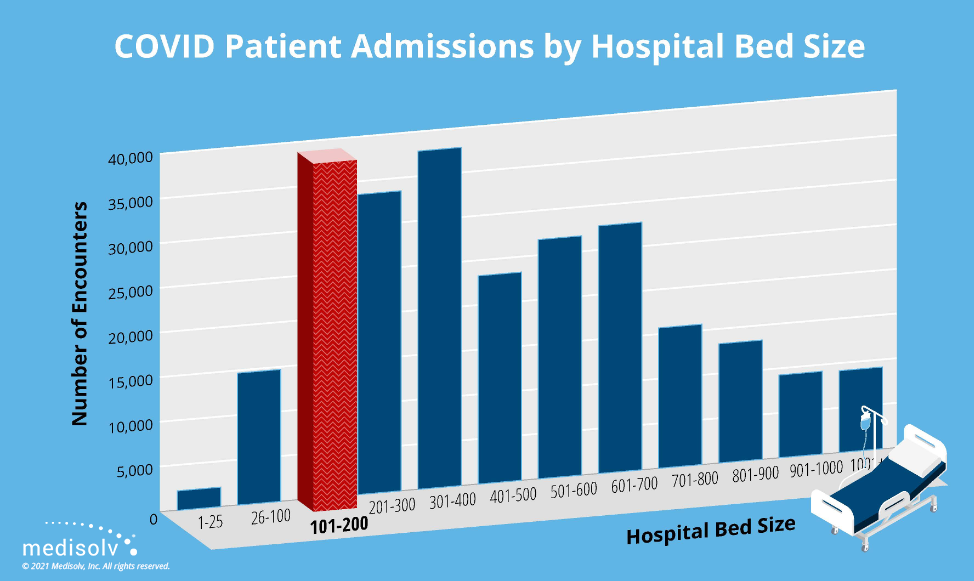
Hospitals with 101 to 200 beds had the most, and largest percentage of COVID-19 patient admissions over the nine-month study period.
Takeaway for Quality Departments
COVID outbreaks weren’t limited to urban areas with large academic medical centers, teaching hospitals or government-owned public hospitals. Quality departments at community and suburban hospitals must be as prepared as their peers in other settings to care for patients diagnosed with COVID.

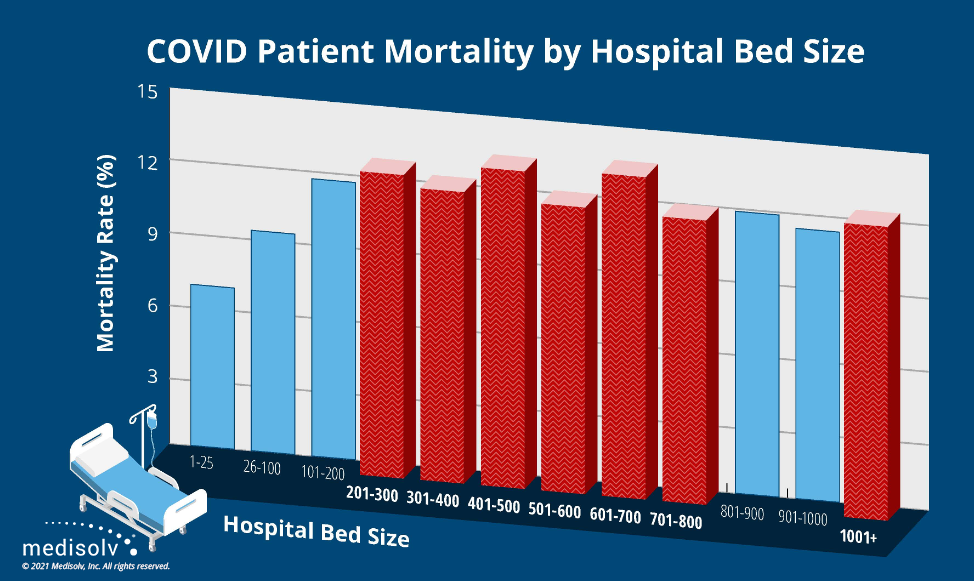
The inpatient mortality rate of patients diagnosed with COVID-19 was generally higher at larger hospitals than at smaller hospitals during the nine-month study period.
Takeaway for Quality Departments
The data suggests that larger hospitals, likely in more urban areas, admitted more severely ill patients with a primary or secondary diagnosis of COVID. Quality departments should expect to see that in their numbers. If not, they should investigate the community and clinical reasons underlying any significant variations in that norm.

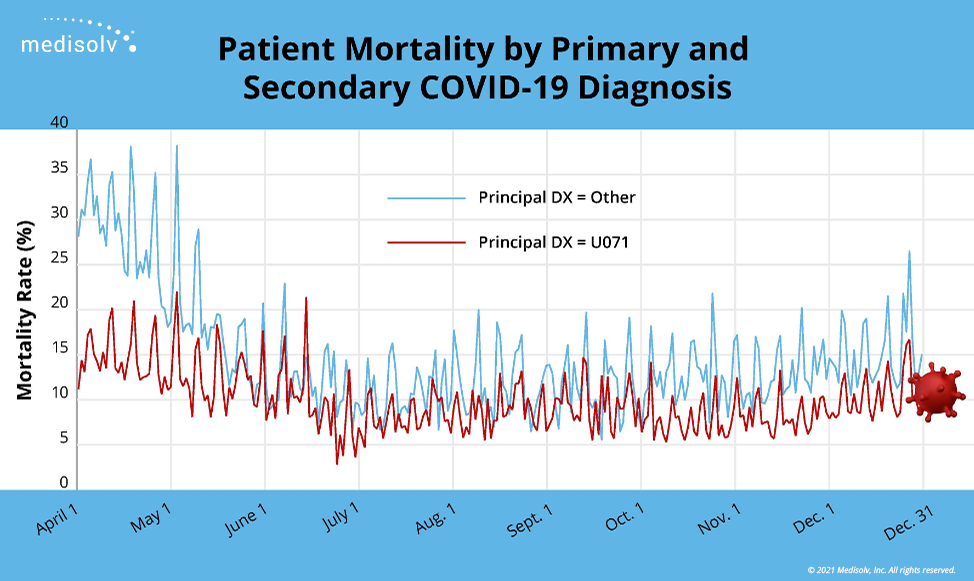
The mortality rate of hospitalized patients with a secondary diagnosis of COVID-19 was consistently higher than the mortality rate of hospitalized patients with a primary diagnosis of COVID.
Takeaway for Quality Departments
Admitted COVID patients with comorbid conditions like cancer, COPD and diabetes ran a significantly higher risk of dying in the hospital. It's essential that quality managers extract and report those comorbid conditions from clinicians' clinical documentation to improve the care and outcomes of admitted COVID patients.

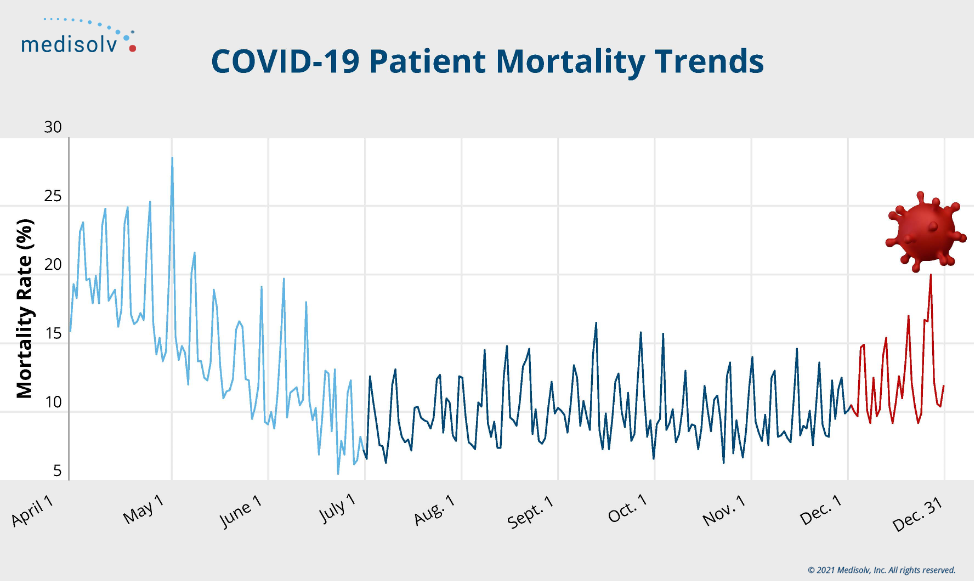
The mortality rate of hospitalized COVID-19 patients dropped significantly from April to July, leveled off during late summer and early fall, and then gradually increased through the end of 2020.
Takeaway for Quality Departments
A steep clinical learning curve brought the COVID inpatient mortality rate down quickly and held it down for months. However, the rate began to climb in late fall. What can quality managers extract and learn from patients' records that would explain the year-end increase, and how could they use that information to improve care and outcomes?
We hope this data sheds a little light on 2020 COVID-19 mortality. If you have additional questions about the study, please send them to questions@medisolv.com.
|
Medisolv Can Help
Here are some resources that might be helpful:
|


.png?width=352&name=BlogImage_State%20of%20IQROQR%20Survey%20(4).png)

Comments