A Review of the October 2024 Care Compare Refresh

In the October 2024 Care Compare update, CMS publicly posted (for the first time) your score on the Safe Use of Opioids eCQM, the Hospital Commitment to Health Equity score, and whether you are participating in the voluntary THA/TKA PRO-PM year.
It’s a quiet posting with loud implications about CMS’s plans to publicly report your data across these new measure types. Care Compare is not just for Claims and Abstracted data anymore.
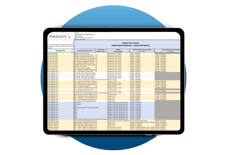
In this article, we review the basics of Care Compare; we provide national eCQM results and compare those to our clients’ performance. We also have an awesome resource for you. We’ve created an Excel file that explains which measures are on Care Compare, and which are used in Star Ratings. It also shows the time periods for both that are currently used on the public website.
Overview
Care Compare is a public-facing website that displays information about your hospital’s performance, including a 1–5 Star Rating. It’s run by CMS and was previously called Hospital Compare.
You are probably somewhat aware that the measures you submit to federal regulatory programs populate these public-facing websites.
CMS uses your performance in these programs to populate Care Compare and the Star Ratings:
- Inpatient Quality Reporting (IQR) Program
- Outpatient Quality Reporting (OQR) Program
- Inpatient Psychiatric Facility Quality Reporting (IPFQR) Program
- Hospital Readmission Reduction Program (HRRP)
- Hospital-Acquired Condition (HAC) Reduction Program
- Hospital Value-Based Purchasing (HVBP) Program
The tricky part is that CMS uses a subset of these measures with different time frames to calculate your Star Rating.
RESOURCE
We’ve made an Excel sheet for you to help sort it all out. The first tab has all measures used for Care Compare and the timelines of data currently used. The next two tabs contain information about which measures are used on the Care Compare website and which measures are used for the current Star Ratings.

|
October 2024 Care Compare Workbook [Download]
|
Mapping Quality Measures to Care Compare
On Care Compare, you can enter your zip code or city/state and look up hospitals near you. I put in Columbia, MD (Medisolv headquarters) and up popped a list of surrounding hospitals.

You’ll notice before I even dive into the details, I can quickly see which hospitals have a better Star Rating and Patient Survey Rating.
Once you click into the individual facility, you will see the hospital’s Star Rating and Patient Survey Rating called out again.

As you scroll, you will see eight accordions that contain more quality performance information. Note that in this release they added two new categories: health equity and patient-reported outcomes. Within those new categories, you’ll see your HCHE results in the health equity tab and your participation (or not) in the THA/TKA PRO-PM voluntary year.

You can click any of those quality categories and it will open a window with details on your hospital’s performance. Once opened, you’ll see the list of measures that CMS publicly displays on Care Compare. Download that resource above and look at the second tab. You’ll see exactly which measures are used in the order that they appear (and with the modified description) and which reporting program they are part of.
Understanding Care Compare Timeframes
Now pay attention; this next part is important.
It’s important to know which measures are being displayed on Care Compare, and it is equally important to know the timeframe of the data being displayed.
Timeframes vary by measure. Furthermore, there are different timeframes for Care Compare measures versus the Star Ratings. Again - reference that resource I gave you in the beginning (first tab).
Here’s the last thing you must know about Care Compare. Not all measures are released at the same time. I had assumed the quarterly refreshes of Care Compare released all publicly reported data. Not so. If you look at the Excel resource I made for you, it contains a column identifying which month(s) each measure is released.
Where's my eCQM Performance?
For the first time, CMS has elevated your eCQM performance to the Care Compare listing page, but just the Safe Use of Opioids eCQM for now. Based on this approach, I would expect to see your eCQM rates for ePC-02 (Cesarean Birth) and ePC-07 (Severe Obstetric Complications) next year when CMS has the mandatory PC eCQM submission data.
You can see your Safe Use of Opioids eCQM results in the first tab labeled “timely and effective care.”
Otherwise, the rest of your eCQM data is buried.
Let me show you how to find it.
- Visit this link: https://data.cms.gov/provider-data/dataset/4j6d-yzce.
- Click the link "Download full dataset" (right side of your screen).
- Unzip the file.
- Search for the files "Timely_and_Effective_Care-Hospital.csv" AND "Maternal_Health-Hospital.csv"
Or, because we love you, here are the files.
[Timely and Effective Care Download]
You’ll note CMS did not release eCQM State or National averages (except for Opioid). So here is a chart that shows the National average by eCQM along with our Clients’ performance.
Measure ID |
Measure Descripton |
2023 National Average |
2023 Medisolv Clients |
|
SAFE_USE_OF_OPIOIDS |
Safe Use of Opioids – Concurrent Prescribing (inverse measure) |
15% |
15% |
|
ePC-01 |
Elective Delivery |
3% |
2% |
|
ePC-02 |
Cesarean Birth |
24% |
24% |
|
ePC-05 |
Exclusive Human Milk Feeding |
57% |
63% |
|
ePC-07a |
Severe Obstetric Complications (All) |
298 |
317 |
|
ePC-07b |
Severe Obstetric Complications (excluding blood transfusions) |
65 |
53 |
|
VTE_1 |
Venous Thromboembolism Prophylaxis |
81% |
93% |
|
VTE_2 |
Intensive Care Unit Venous Thromboembolism Prophylaxis |
92% |
96% |
|
STK_02 |
Discharged on Antithrombotic Therapy |
96% |
94% |
|
STK_03 |
Anticoagulation Therapy for Atrial Fibrillation/Flutter |
73% |
83% |
|
STK_05 |
Antithrombotic Therapy by End of Hospital Day 2 |
92% |
94% |
|
STK_06 |
Discharged on Statin Medication |
95% |
94% |
|
ED_2_Strata_1 |
Admit Decision Time to ED Departure Time for Admitted Patients - non psychiatric/mental health disorders |
85 |
120 |
|
ED_2_Strata_2 |
Admit Decision Time to ED Departure Time for Admitted Patients – psychiatric/mental health disorders |
167 |
377 |
In Summary:
We hope this article and resource were helpful to you. Consider partnering with Medisolv to help improve your measurement performance and keep you up to date with the latest information.
Quality leaders are often the ones responsible for monitoring and disseminating this information. It’s important that as a quality leader, you know which measures are used to populate what the public sees on Care Compare. You should also understand the date ranges currently used so you can speak to it internally and to the public. Medisolv can be the resource you need to drive this initiative.
Think about focusing your future quality efforts on improving any public reputation measures that look especially bad online. Share your results with your team, including your marketing team. This will help stakeholders understand how important your quality team’s efforts are and how they affect your organization’s public reputation.
Medisolv Can HelpAlong with award-winning software, each client receives a dedicated Clinical Quality Advisor that helps you with your technical and clinical needs. We consistently hear from our clients that the biggest differentiator between Medisolv and other vendors is the level of one-oo-one support. Especially if you use an EHR vendor right now, you’ll notice a huge difference.
|

.png?width=352&name=2026%20Quality%20Reporting%20Deadlines%20Guide%20(1).png)


Comments