Medisolv’s MIPS Reporting Results

Results from the second year of MIPS
2018 marked the second complete year of the MIPS program. Last year, we put together an infographic showing our clients’ performance in the first year of MIPS. This year we took it a step further and included even more data points for comparison.We are very proud that our clients were able to maintain their excellent performance. We strongly believe that our close client relationships benefit both parties and contribute to these outstanding results.
That’s why in the 2019 Best in KLAS report we were ranked #1 for Quality Management with one of our highest scores being in “quality of support.” It is this deep level of support that we provide which differentiates us from our competitors.
On to the numbers. Take a look below and see how your organization compares.
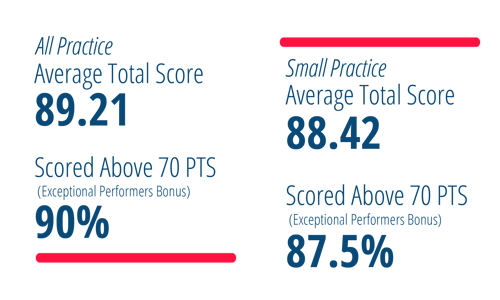
Medisolv Clients' Average Total Scores:

As you can see, for our clients, it doesn’t make a difference if they are big or small. It matters which measures you pick and how often you review and adjust. That’s what will impact your final score.
In 2018, any practice that scored 70 points or above received an exceptional performance bonus that was added on to any positive adjustment they already received.
For more information about how MIPS reimbursements work, read our blog: MIPS Reimbursements: How does it work?
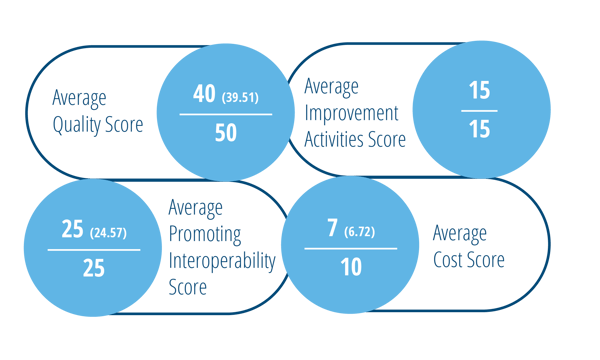
Medisolv Clients' Average Category Scores:

One thing to note here is how many of our clients were able to achieve perfect scores in the Promoting Interoperability and Improvement Activities categories. If you are not getting perfect scores in these categories, you may be leaving money on the table. In our experience, it’s been relatively easy to manage these categories with our clients and get them to their max points.
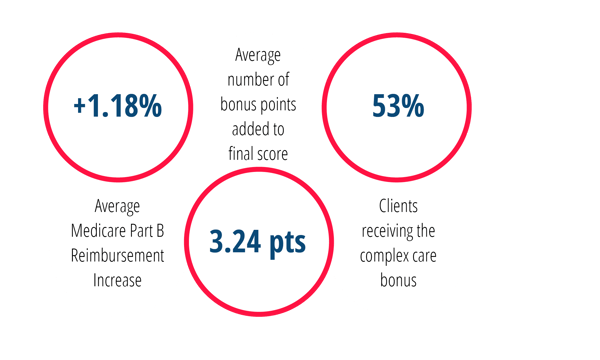
Medisolv Clients' Additional Results:

If you can recall, practices were pretty furious last year that the actual percent of reimbursement given to high scorers was so low. For instance, one of our practices scored 100% and received 2.12% reimbursement. CMS had said they could max at 4% + the exceptional performance bonus money. Well, where in the heck did that money go?
Remember that the program is budget neutral so we can deduce that most practices were able to achieve a pretty good score. Keep in mind that in 2018, CMS excluded even more practices from having to report, which made your pool even smaller.
That means to make it worth your while to participate in MIPS, you really need to concentrate on getting the best score possible.
Before we leave you today, I wanted to throw in a quick summary of your 2019 requirements. This year, CMS did the opposite action and threw in a bunch of new clinician types that are eligible for MIPS reporting. That does widen your pool of participants a bit. Also note that the penalties for poor performers are much more severe. We anticipate that these adjustments will make it more financially beneficial to the MIPS top performers.
2019 MIPS REQUIREMENTS
Eligible Clinician Types
- Physician
- Physician Assistant
- Nurse Practitioner
- Clinical Nurse Specialist
- Certified Registered Nurse Anesthetist
- Physical Therapist
- Occupational Therapist
- Qualified Speech Language Pathologist
- Qualified Audiologist
- Clinical Psychologist
- Registered Dietitian or Nutrition Professional
Payment Adjustment
|
-7% Payments at Risk (Maximum) |
|
|
7% (Up to) Payments to Gain PLUS bonus money if you qualify as a top performer |
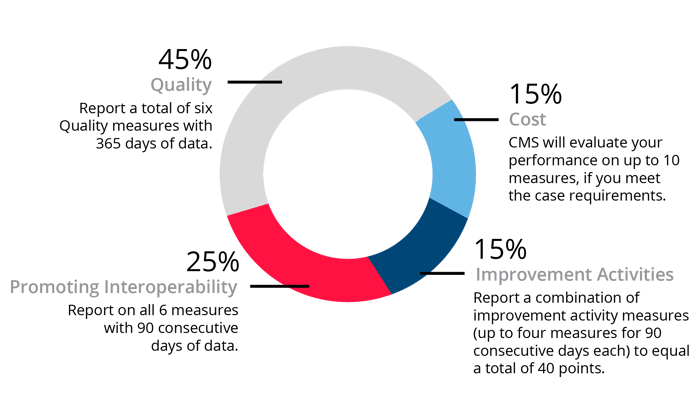
Category Weights and requirements

Deadlines
Quality & Cost Category Start Date
January 1, 2019
This is the start date to track 365 days of Quality and Cost category measures.
PI & IA Category Start Date
January 1 – October 3, 2019
You may start anytime between January 1 and October 3, 2019 to track your measures to meet the minimum 90 day requirement.
Submission Deadline
March 31, 2020
The last day to submit all of your performance data is March 31, 2020.


.png?width=352&name=2026%20Quality%20Reporting%20Deadlines%20Guide%20(1).png)


Comments