

Did you know that a whopping 751 hospitals were penalized for their high Hospital-Acquired Condition (HAC) rates this year?
The HAC program is one of the CMS programs that can hit hospitals with a penalty and significant revenue loss. And this year, the HAC scores look a little different than they have in years past. Before we share which states landed on the list of the worst HAC performers, let’s dive into how the HAC program works and what it means to get a HAC penalty.
THE HAC PROGRAM
In 2015, the HAC program was created under the Affordable Care Act (ACA) in an effort to improve patient safety by lowering rates of Hospital-Acquired Conditions. HACs are conditions—such as post-surgery infections and falls—that patients acquire while receiving treatment for another condition during their hospital stay.
So, what’s at risk for having too many HACs? Well, a few things:
- Hospitals among the bottom 25% of the worst HAC performers will get a 1% percent reduction to their Medicare reimbursement funding.
- HAC performance is published each year on Hospital Compare for the general public to see.
- A high amount of HACs will require an improvement plan.
How a hac score is calculated
This year we saw a change in how the HAC score is calculated. For Fiscal Year (FY) 2018, CMS implemented the Winsorized z-score methodology, a new scoring methodology specifically for HAC measure calculations. The Winsorizied-z score methodology is based on the actual measure value rather than the decile of the measure, which was the method used in 2015, 2016 and 2017. Because of this new scoring methodology, total HAC scores are now typically between -3 and 3 compared to a range of 1 to 10 in 2017. Here is an example of how this score is calculated.
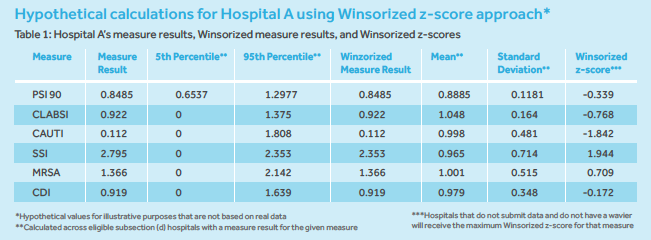
Here is the full infographic from CMS that is helpful in understanding this new methodology.
CMS’ method for finalizing and determining total HAC scores, however, hasn’t changed. A hospital’s total HAC score is based on six Quality measures:
- (Patient Safety Indicators) PSI 90 composite measure
- Central Line Associated Bloodstream Infections (CLABSI)
- Catheter Associated Urinary Tract Infections (CAUTI)
- Surgical Site Infection (SSI) (Abdominal Hysterectomies and Colon Procedures)
- Methicillin-resistant Staphylococcus aureus (MRSA)
- Clostridium difficile (CDI)
These measures are put into two different domains and then weighted to finalize the total HAC score.
You can learn more about total HAC calculations and the new scoring mythology for HAC measures here.
Worst performers in 2018
In 2018, 751 of the 3,305 eligible hospitals were penalized for being the worst-performing 25% of all hospitals.
You can see the worst performers by state and the states with the most penalized hospitals in the slideshow below. Keep in mind that FY 2018 results are based on data from years prior; July 1, 2014-September 30, 2015 for measures in the first domain, and January 1, 2015-December 31, 2016 for measures in the second domain.
*The lists below were finalized by looking only at the hospitals that were penalized by CMS.
Worst Average Score By State.
- Idaho (With an average score of 1.598)
- South Dakota (With an average score of 1.360)
- Montana (With an average score of 1.110)
- Alaska (With an average score of 1.108)
- Minnesota (With an average score of 1.092)
- Oregon (With an average score of 1.032)
- Texas (With an average score of 1.032)
- Utah (With an average score of 1.027)
- Virginia (With an average score of 0.977)
- Arkansas (With an average score of 0.946)
Most Hospitals Penalized By State.
- California: 89 hospitals (With an average score of 0.746)
- New York: 65 hospitals (With an average score of 0.794)
- Texas: 51 hospitals (With an average score of 1.032)
- Florida: 47 hospitals (With an average score of 0.754)
- Georgia: 36 hospitals (With an average score of 0.757)
- Pennsylvania: 33 hospitals (With an average score of 0.719)
- Louisiana: 26 hospitals (With an average score of 0.897)
- Tennessee: 25 hospitals (With an average score of 0.934)
- Illinois: 22 hospitals (With an average score of 0.830)
- North Carolina: 21 hospitals (With an average score of 0.771)
Medisolv is dedicated to helping hospitals improve the performance of their quality measures, including HAC performance, each year. Learn how you can take your first step toward quality improvement by contacting us today.
Stay Ahead of the Quality CurveMedisolv Can HelpMedisolv’s Value Maximizer software, uses machine learning and predictive modeling to forecast your future years payments in the CMS hospital quality programs (HAC, HVBP, HRRP). Our simulation guides your team on how to optimize your performance to maximize your reimbursements. Here are some resources you may find useful. Blog Post: "How to Use CMS' Value-Based Programs Data" |


Comments